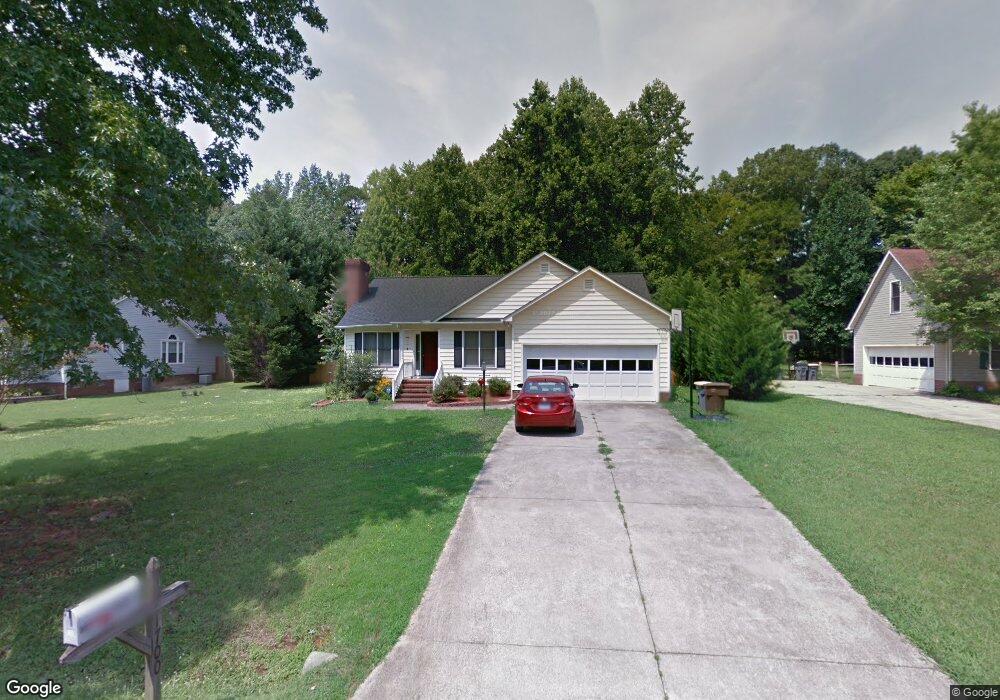
1706 Azalea Ave Kannapolis, NC 28081
Estimated Value: $357,000 - $363,000
3
Beds
2
Baths
1,684
Sq Ft
$214/Sq Ft
Est. Value
About This Home
This home is located at 1706 Azalea Ave, Kannapolis, NC 28081 and is currently estimated at $359,873, approximately $213 per square foot. 1706 Azalea Ave is a home located in Cabarrus County with nearby schools including Shady Brook Elementary School, Kannapolis Middle, and A.L. Brown High School.
Ownership History
Date
Name
Owned For
Owner Type
Purchase Details
Closed on
Dec 8, 2025
Sold by
Opendoor Property Trust
Bought by
Gibson Montgomery Cheryl
Current Estimated Value
Home Financials for this Owner
Home Financials are based on the most recent Mortgage that was taken out on this home.
Original Mortgage
$65,000
Outstanding Balance
$64,938
Interest Rate
6.19%
Mortgage Type
New Conventional
Estimated Equity
$294,935
Purchase Details
Closed on
Sep 29, 2025
Sold by
Julian Jeremy and Julian Megan
Bought by
Opendoor Property Trust
Purchase Details
Closed on
Dec 30, 2016
Sold by
Hunter Kathlen A
Bought by
Julian Jeremy and Julian Megan
Home Financials for this Owner
Home Financials are based on the most recent Mortgage that was taken out on this home.
Original Mortgage
$169,750
Interest Rate
3.94%
Mortgage Type
New Conventional
Purchase Details
Closed on
Mar 7, 2007
Sold by
Maher Guy Robert and Maher Staci Lynn
Bought by
Hunter Kathleen A
Home Financials for this Owner
Home Financials are based on the most recent Mortgage that was taken out on this home.
Original Mortgage
$135,000
Interest Rate
6.19%
Mortgage Type
Purchase Money Mortgage
Purchase Details
Closed on
Feb 1, 1991
Bought by
Maher Guy Robert
Create a Home Valuation Report for This Property
The Home Valuation Report is an in-depth analysis detailing your home's value as well as a comparison with similar homes in the area
Home Values in the Area
Average Home Value in this Area
Purchase History
| Date | Buyer | Sale Price | Title Company |
|---|---|---|---|
| Gibson Montgomery Cheryl | $365,000 | None Listed On Document | |
| Opendoor Property Trust | $362,000 | None Listed On Document | |
| Julian Jeremy | $175,000 | None Available | |
| Hunter Kathleen A | $170,000 | None Available | |
| Maher Guy Robert | $99,000 | -- |
Source: Public Records
Mortgage History
| Date | Status | Borrower | Loan Amount |
|---|---|---|---|
| Open | Gibson Montgomery Cheryl | $65,000 | |
| Previous Owner | Julian Jeremy | $169,750 | |
| Previous Owner | Hunter Kathleen A | $135,000 |
Source: Public Records
Tax History
| Year | Tax Paid | Tax Assessment Tax Assessment Total Assessment is a certain percentage of the fair market value that is determined by local assessors to be the total taxable value of land and additions on the property. | Land | Improvement |
|---|---|---|---|---|
| 2025 | $3,189 | $280,850 | $41,520 | $239,330 |
| 2024 | $3,189 | $280,850 | $41,520 | $239,330 |
| 2023 | $2,471 | $180,340 | $29,060 | $151,280 |
| 2022 | $2,471 | $180,340 | $29,060 | $151,280 |
| 2021 | $2,471 | $180,340 | $29,060 | $151,280 |
| 2020 | $2,471 | $180,340 | $29,060 | $151,280 |
| 2019 | $1,976 | $144,210 | $24,910 | $119,300 |
| 2018 | $1,947 | $144,210 | $24,910 | $119,300 |
| 2017 | $1,918 | $144,210 | $24,910 | $119,300 |
| 2016 | $1,918 | $147,330 | $27,680 | $119,650 |
| 2015 | $1,856 | $147,330 | $27,680 | $119,650 |
| 2014 | $1,856 | $147,330 | $27,680 | $119,650 |
Source: Public Records
Map
Nearby Homes
- 1436 Trotters Ridge Rd
- 301 Briarcliff Dr
- 2448 Spruce St
- 2342 Bloomfield Dr
- 1410 Oakwood Ave
- 251 Briarcliff Dr
- 2609 Lamp Post Ln
- 2305 Bloomfield Dr
- 2605 Lamplighter Dr
- 366 Courtland Ct
- 2775 Lamplighter Dr
- 626 Flicker St
- 1229 Brecken Ct
- 112 Elwood St
- 2203 Oakhurst Ct
- 128 Greenview Dr
- 2737 Lamplighter Dr
- 1700 Oakwood Ave
- 1407 Sherwood Dr
- 1272 Brecken Ct
- 1704 Azalea Ave
- 1720 Azalea Ave
- 1690 Azalea Ave
- 1708 Azalea Ave
- 1712 Azalea Ave
- 1711 Azalea Ave
- 1701 Azalea Ave
- 1716 Azalea Ave
- 1703 Azalea Ave
- 1750 Azalea Ave
- 1626 Azalea Ave
- 916 Coventry Rd
- 1627 Azalea Ave
- 918 Coventry Rd
- 1760 Azalea Ave
- 912 Coventry Rd
- 924 Coventry Rd
- 928 Coventry Rd
- 930 Coventry Rd
- 1617 Azalea Ave
Your Personal Tour Guide
Ask me questions while you tour the home.