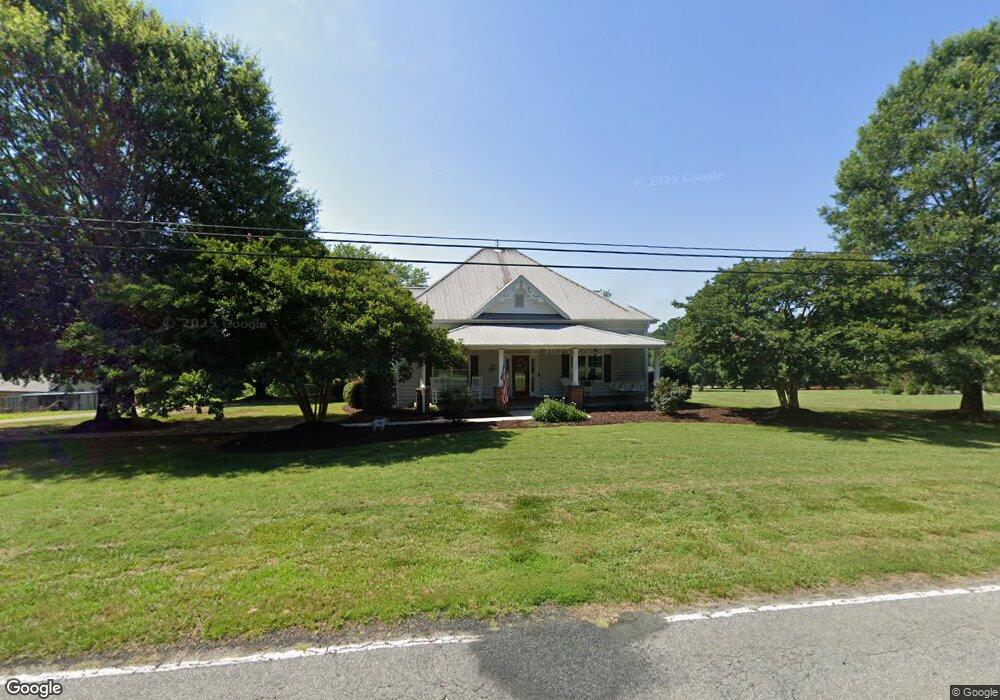
1706 Belle Shoals Rd Pickens, SC 29671
Estimated Value: $660,000
3
Beds
4
Baths
2,381
Sq Ft
$277/Sq Ft
Est. Value
About This Home
This home is located at 1706 Belle Shoals Rd, Pickens, SC 29671 and is currently estimated at $660,000, approximately $277 per square foot. 1706 Belle Shoals Rd is a home with nearby schools including Pickens Elementary School, Pickens Middle School, and Pickens High School.
Ownership History
Date
Name
Owned For
Owner Type
Purchase Details
Closed on
Aug 21, 2024
Sold by
Gregory Smith Family Revocable Living Tr and Smith Gregory D
Bought by
Smith Sandee
Current Estimated Value
Purchase Details
Closed on
Oct 15, 2021
Sold by
Smith Gregory D
Bought by
Gregory Smith Family Revocable Living Trust and Smith
Purchase Details
Closed on
Oct 9, 2021
Sold by
Smith Gregory D
Bought by
Smith Gregory D and Gregory Smith Family Rlt
Purchase Details
Closed on
May 15, 2019
Sold by
Wimpey Christopher L and Wimpey Kerry M
Bought by
Smith Gregory D
Home Financials for this Owner
Home Financials are based on the most recent Mortgage that was taken out on this home.
Original Mortgage
$350,000
Interest Rate
4%
Mortgage Type
New Conventional
Purchase Details
Closed on
Jan 20, 2011
Sold by
Wimpey Kerry M
Bought by
Wimpey Christopher L
Create a Home Valuation Report for This Property
The Home Valuation Report is an in-depth analysis detailing your home's value as well as a comparison with similar homes in the area
Home Values in the Area
Average Home Value in this Area
Purchase History
| Date | Buyer | Sale Price | Title Company |
|---|---|---|---|
| Smith Sandee | -- | None Listed On Document | |
| Smith Sandee | -- | None Listed On Document | |
| Gregory Smith Family Revocable Living Trust | -- | None Listed On Document | |
| Gregory Smith Family Revocable Living Trust | -- | None Listed On Document | |
| Smith Gregory D | -- | None Available | |
| Smith Gregory D | $550,000 | None Available | |
| Wimpey Christopher L | -- | -- |
Source: Public Records
Mortgage History
| Date | Status | Borrower | Loan Amount |
|---|---|---|---|
| Previous Owner | Smith Gregory D | $350,000 |
Source: Public Records
Tax History Compared to Growth
Tax History
| Year | Tax Paid | Tax Assessment Tax Assessment Total Assessment is a certain percentage of the fair market value that is determined by local assessors to be the total taxable value of land and additions on the property. | Land | Improvement |
|---|---|---|---|---|
| 2023 | $2,424 | $22,180 | $3,140 | $19,040 |
| 2022 | $2,435 | $22,180 | $3,140 | $19,040 |
| 2021 | $2,196 | $22,180 | $3,140 | $19,040 |
| 2020 | $2,203 | $22,000 | $3,140 | $18,860 |
| 2019 | $1,333 | $12,290 | $2,200 | $10,090 |
| 2018 | $1,189 | $10,680 | $1,740 | $8,940 |
| 2017 | $1,152 | $10,680 | $1,740 | $8,940 |
| 2015 | $1,165 | $10,680 | $0 | $0 |
| 2008 | -- | $2,450 | $2,090 | $360 |
Source: Public Records
Map
Nearby Homes
- 190 Heritage Dr
- 00 Mauldin Lake Rd
- 149 Roanoke Rd
- 1932 Belle Shoals Rd
- 573 Mauldin Lake Rd
- 191 Juniper Ln
- 00 Odell Rd
- 637 Odell Rd
- 213 Legacy Ln
- 204 Old Glory Ct
- 231 Roanoke Rd
- 209 Old Glory Ct
- 108 Walters Way
- 112 Walters Way
- 1021 Old Bethlehem School Rd
- 0 State Road S-39-122
- 112 Walters Way
- 106 Old Glory Ct
- 104 Old Glory Ct
- 106 Old Glory Ct
- 1720 Belle Shoals Rd
- 1703 Belle Shoals Rd
- 1721 Belle Shoals Rd
- 1736 Belle Shoals Rd
- 1700 Belle Shoals Rd
- 1676 Belle Shoals Rd
- 1730 Belle Shoals Rd
- 1733 Belle Shoals Rd
- 1754 Belle Shoals Rd
- 1747 Belle Shoals Rd
- 1668 Belle Shoals Rd
- 1762 Belle Shoals Rd
- 1755 Belle Shoals Rd
- 1751 Belle Shoals Rd
- 1802 Belle Shoals Rd
- 108 Heritage Dr
- 252 Heraldry Dr
- 122 Heritage Dr
- 1639 Belle Shoals Rd
- 1647 Belle Shoals Rd