I
Seller's Agent in 2019
Isabelle Martinez
Carolina Elite Real Estate
Estimated Value: $83,710 - $246,000
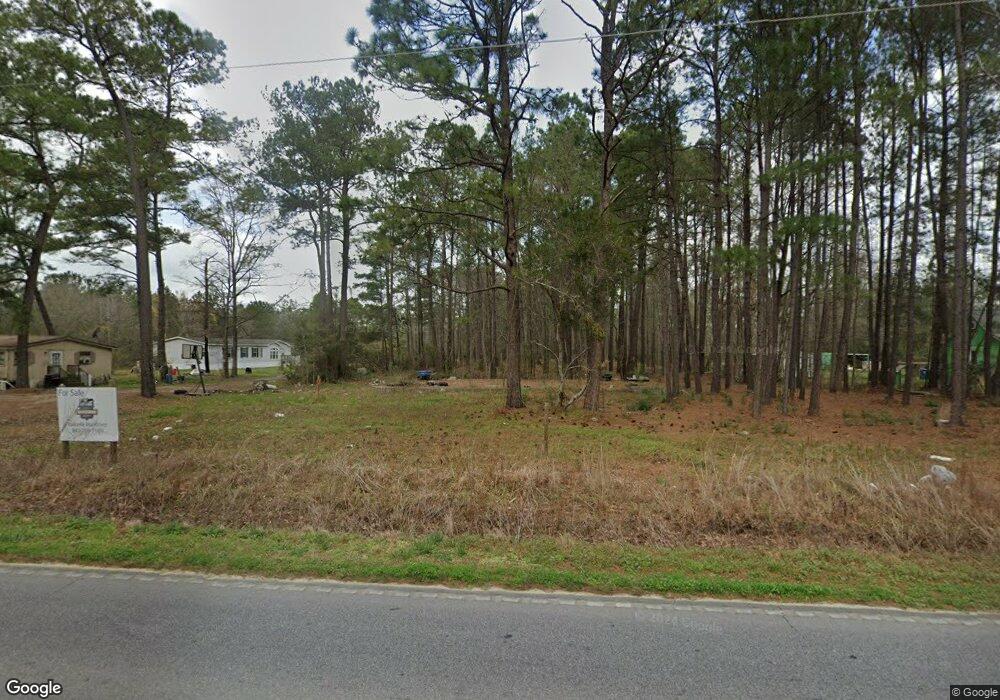
Good investment in a growing area. Warewr and sewer will be coming soon. This lot approved for 2 mobile homes.Has 1 approved septic system and 1 well.Property sold in as is condition. Owned by the same family for years.
Last Agent to Sell the Property
Isabelle Martinez
Carolina Elite Real Estate License #18751 Listed on: 12/28/2018
| Date | Event | Price | List to Sale | Price per Sq Ft |
|---|---|---|---|---|
| 02/20/2019 02/20/19 | Sold | $50,000 | 0.0% | -- |
| 01/21/2019 01/21/19 | Pending | -- | -- | -- |
| 12/28/2018 12/28/18 | For Sale | $50,000 | -- | -- |
| Year | Tax Paid | Tax Assessment Tax Assessment Total Assessment is a certain percentage of the fair market value that is determined by local assessors to be the total taxable value of land and additions on the property. | Land | Improvement |
|---|---|---|---|---|
| 2025 | $604 | $39,675 | $39,675 | $0 |
| 2024 | $600 | $2,380 | $2,380 | $0 |
| 2023 | $600 | $2,380 | $2,380 | $0 |
| 2022 | $579 | $2,070 | $2,070 | $0 |
| 2021 | $584 | $2,070 | $2,070 | $0 |
| 2020 | $586 | $2,070 | $2,070 | $0 |
| 2019 | $1,408 | $4,086 | $2,070 | $2,016 |
| 2018 | $1,235 | $3,132 | $1,284 | $1,848 |
| 2017 | $1,245 | $3,132 | $1,284 | $1,848 |
| 2016 | $1,253 | $3,130 | $1,280 | $1,850 |
| 2015 | $1,199 | $3,130 | $1,280 | $1,850 |
| 2014 | $1,134 | $3,130 | $1,280 | $1,850 |
| 2013 | -- | $3,130 | $1,280 | $1,850 |
I
Seller's Agent in 2019
Isabelle Martinez
Carolina Elite Real Estate

Buyer's Agent in 2019
Rebecca Batley
RE/MAX
35 Total Sales
Source: CHS Regional MLS
MLS Number: 18033479
APN: 160-00-02-049
Disclaimer: Certain information contained herein is derived from information provided by parties other than Homes.com. All information provided is deemed reliable, but is not guaranteed to be accurate and should be independently verified.
![]() The information is being provided by Charleston Trident MLS. Information deemed reliable but not guaranteed. Information is provided for consumers' personal, non-commercial use, and may not be used for any purpose other than the identification of potential properties for purchase. © 2026 Charleston Trident MLS. All Rights Reserved
The information is being provided by Charleston Trident MLS. Information deemed reliable but not guaranteed. Information is provided for consumers' personal, non-commercial use, and may not be used for any purpose other than the identification of potential properties for purchase. © 2026 Charleston Trident MLS. All Rights Reserved