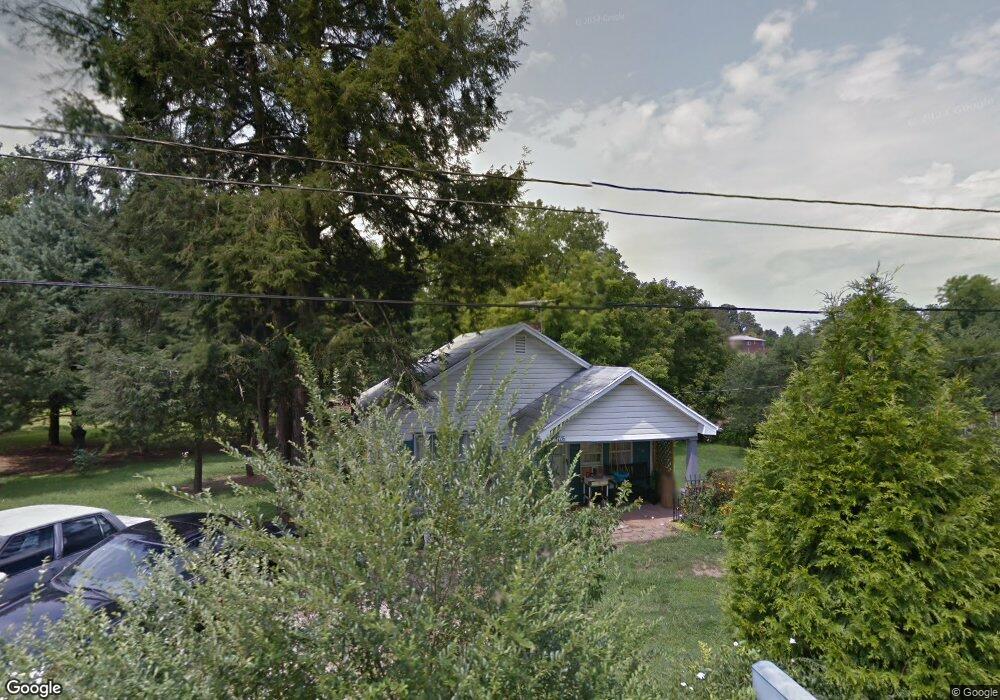
1706 Bumgarner Dr Morganton, NC 28655
Estimated Value: $118,644 - $167,000
2
Beds
1
Bath
728
Sq Ft
$201/Sq Ft
Est. Value
About This Home
This home is located at 1706 Bumgarner Dr, Morganton, NC 28655 and is currently estimated at $146,661, approximately $201 per square foot. 1706 Bumgarner Dr is a home located in Burke County with nearby schools including Drexel Elementary School, Heritage Middle School, and Jimmy C. Draughn High School.
Ownership History
Date
Name
Owned For
Owner Type
Purchase Details
Closed on
Feb 19, 2025
Sold by
Hayward Vernon B
Bought by
Hayward Vernon B and Alleane Hoye Franklin Peggy
Current Estimated Value
Purchase Details
Closed on
May 6, 2020
Sold by
Hayward Katherine A
Bought by
Hayward Vernon B
Purchase Details
Closed on
Apr 6, 2020
Sold by
D & D Investment Builders
Bought by
Hayward Katherine A
Create a Home Valuation Report for This Property
The Home Valuation Report is an in-depth analysis detailing your home's value as well as a comparison with similar homes in the area
Home Values in the Area
Average Home Value in this Area
Purchase History
| Date | Buyer | Sale Price | Title Company |
|---|---|---|---|
| Hayward Vernon B | -- | None Listed On Document | |
| Hoye Franklin Peggy Alleane | -- | None Listed On Document | |
| Hayward Vernon B | -- | None Available | |
| Hayward Katherine A | -- | None Available |
Source: Public Records
Tax History
| Year | Tax Paid | Tax Assessment Tax Assessment Total Assessment is a certain percentage of the fair market value that is determined by local assessors to be the total taxable value of land and additions on the property. | Land | Improvement |
|---|---|---|---|---|
| 2025 | $441 | $53,280 | $15,113 | $38,167 |
| 2024 | $440 | $53,280 | $15,113 | $38,167 |
| 2023 | $440 | $53,280 | $15,113 | $38,167 |
| 2022 | $337 | $33,002 | $7,200 | $25,802 |
| 2021 | $331 | $33,002 | $7,200 | $25,802 |
| 2020 | $327 | $33,002 | $7,200 | $25,802 |
| 2019 | $327 | $33,002 | $7,200 | $25,802 |
| 2018 | $326 | $32,881 | $7,200 | $25,681 |
| 2017 | $324 | $32,881 | $7,200 | $25,681 |
| 2016 | $314 | $32,881 | $7,200 | $25,681 |
| 2015 | $311 | $32,881 | $7,200 | $25,681 |
| 2014 | $310 | $32,881 | $7,200 | $25,681 |
| 2013 | $310 | $32,881 | $7,200 | $25,681 |
Source: Public Records
Map
Nearby Homes
- 1720 Bumgarner Dr
- 1761 Dearborn Street Extension
- 1801 Highland Ave
- 113 Williams Way
- 111 Baxter St
- 225 Baxter St
- 221 Valdese Dr
- 3994 Seitz Rd
- 100 Reed St
- 2106 Enon Rd
- 203 Cohen St
- 308 Park Ave Unit 310
- 102 Page St
- 218 Grandfathers Pass NW Unit 3
- 2168 Enon Rd
- 200 W Settings Blvd NW
- 3435 Nelson Ln
- 161 W Settings Blvd NW
- 606 Park Ave
- 109 Shortoff Trail
- 1700 Bumgarner Dr
- 1699 Bumgarner Dr
- 1703 Bumgarner Dr
- 1695 Bumgarner Dr
- 1690 Bumgarner Dr
- 105 B St
- 105 Starrett Ln
- 161 Bryant Rd
- 1685 Bumgarner Dr
- 1684 Bumgarner Dr
- 119 Bryant Rd
- 103 B St
- 1670 Rawleigh St
- 1793 Dearborn St
- 102 B St
- 1668 Bumgarner Dr
- 110 B St
- 1669 Bumgarner Dr
- 1662 Rawleigh St
- 1793 Dearborn Street Extension
Your Personal Tour Guide
Ask me questions while you tour the home.