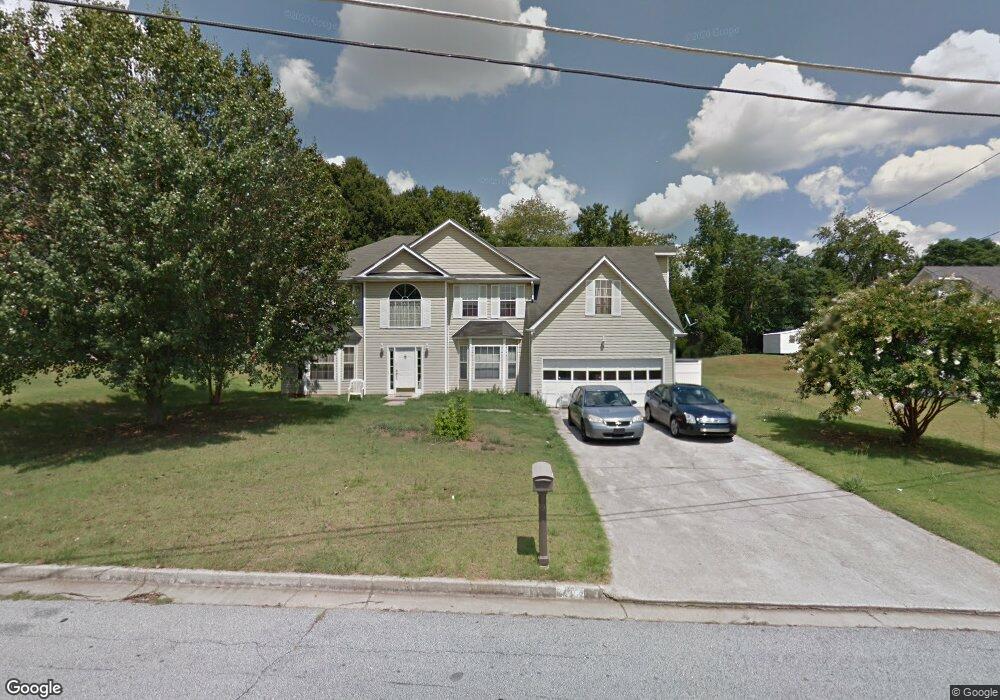
1706 Duren Fields Way Lithonia, GA 30058
Estimated Value: $341,000 - $367,000
5
Beds
5
Baths
2,173
Sq Ft
$163/Sq Ft
Est. Value
About This Home
This home is located at 1706 Duren Fields Way, Lithonia, GA 30058 and is currently estimated at $354,350, approximately $163 per square foot. 1706 Duren Fields Way is a home located in DeKalb County with nearby schools including Redan Elementary School, Redan Middle School, and Redan High School.
Ownership History
Date
Name
Owned For
Owner Type
Purchase Details
Closed on
Mar 11, 2021
Sold by
Mupr 3 Assets Llc
Bought by
Cpi Amherst Sfr Program Ii Owner Llc
Current Estimated Value
Purchase Details
Closed on
Dec 17, 2020
Sold by
Srmz 2 Llc
Bought by
Mupr 3 Assets Llc
Purchase Details
Closed on
Mar 20, 2019
Sold by
Jeff 1 Llc
Bought by
Srmz 2 Llc
Purchase Details
Closed on
Jun 7, 2016
Sold by
Anderson Jessica L
Bought by
Jeff 1 Llc
Purchase Details
Closed on
Jul 15, 2002
Sold by
Anderson Paul W
Bought by
Anderson Jessica L
Purchase Details
Closed on
May 28, 1999
Sold by
Flat Shoals Development Co
Bought by
Anderson Paul W and Anderson Jessica L
Home Financials for this Owner
Home Financials are based on the most recent Mortgage that was taken out on this home.
Original Mortgage
$153,367
Interest Rate
7.66%
Mortgage Type
VA
Create a Home Valuation Report for This Property
The Home Valuation Report is an in-depth analysis detailing your home's value as well as a comparison with similar homes in the area
Home Values in the Area
Average Home Value in this Area
Purchase History
| Date | Buyer | Sale Price | Title Company |
|---|---|---|---|
| Cpi Amherst Sfr Program Ii Owner Llc | $350,710 | -- | |
| Mupr 3 Assets Llc | $261,364 | -- | |
| Srmz 2 Llc | $189,312 | -- | |
| Jeff 1 Llc | $118,000 | -- | |
| Anderson Jessica L | -- | -- | |
| Anderson Paul W | $148,900 | -- |
Source: Public Records
Mortgage History
| Date | Status | Borrower | Loan Amount |
|---|---|---|---|
| Previous Owner | Anderson Paul W | $153,367 |
Source: Public Records
Tax History
| Year | Tax Paid | Tax Assessment Tax Assessment Total Assessment is a certain percentage of the fair market value that is determined by local assessors to be the total taxable value of land and additions on the property. | Land | Improvement |
|---|---|---|---|---|
| 2025 | $6,460 | $136,720 | $14,000 | $122,720 |
| 2024 | $5,381 | $112,000 | $13,440 | $98,560 |
| 2023 | $5,381 | $112,000 | $13,440 | $98,560 |
Source: Public Records
Map
Nearby Homes
- 5932 Hallwood Ct
- 5934 S Deshon Ct
- 5928 S Deshon Ct
- 6024 S Deshon Ct
- 5940 Fairfield Estates Dr
- 5918 Fairfield Estates Dr
- 5851 Christopher Ln
- 5943 Christopher Ln
- 5964 Giles Rd
- 6236 Springwater Ln Unit 1
- 5972 Giles Rd
- 5980 Giles Rd
- 5789 Dorian Ct
- 5743 Tunbridge Wells Rd
- 5851 Giles Rd
- 1629 Phillips Rd
- 5784 Albans Cir Unit 1
- 2245 Wellborn Rd
- 1821 Herringbone Hollow
- 1598 Dillwood Ct
- 1714 Duren Fields Way
- 1696 Duren Fields Way
- 5942 Duren Fields Place Unit 2
- 1722 Duren Fields Way Unit II
- 1684 Duren Fields Way Unit 2
- 5943 Duren Fields Place
- 5943 Duren Fields Place Unit II
- 5934 Duren Fields Place
- 1681 Wellborn Rd
- 1723 Duren Fields Way Unit 2
- 1681 Duren Fields Way
- 1695 Duren Fields Way Unit 2
- 1687 Duren Fields Way Unit II
- 5935 Duren Fields Place
- 1658 Duren Fields Way
- 1730 Duren Fields Way
- 5984 Duren Meadows Dr
- 1673 Duren Fields Way Unit 2
- 5926 Duren Fields Place Unit 30
- 5926 Duren Fields Place
Your Personal Tour Guide
Ask me questions while you tour the home.