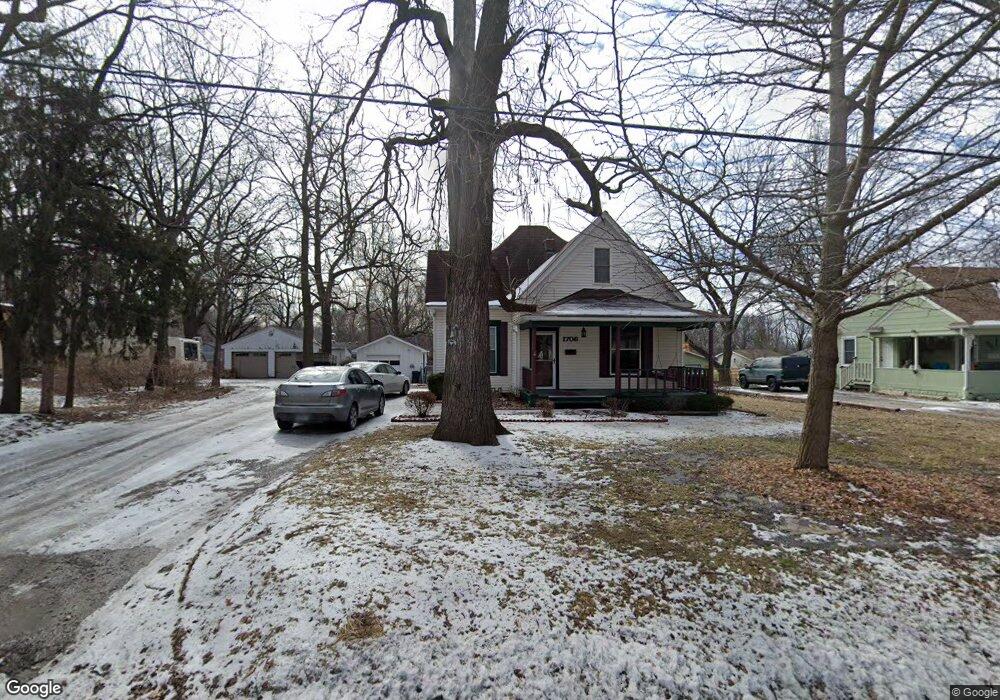
1706 SW Walnut St Blue Springs, MO 64015
Estimated Value: $201,000 - $228,000
2
Beds
1
Bath
1,111
Sq Ft
$191/Sq Ft
Est. Value
About This Home
This home is located at 1706 SW Walnut St, Blue Springs, MO 64015 and is currently estimated at $211,923, approximately $190 per square foot. 1706 SW Walnut St is a home located in Jackson County with nearby schools including Thomas J. Ultican Elementary School, Paul Kinder Middle School, and Blue Springs High School.
Ownership History
Date
Name
Owned For
Owner Type
Purchase Details
Closed on
Sep 27, 2000
Sold by
Bolte Richard E and Bolte Sharon K
Bought by
White David Wayne
Current Estimated Value
Home Financials for this Owner
Home Financials are based on the most recent Mortgage that was taken out on this home.
Original Mortgage
$62,966
Outstanding Balance
$22,737
Interest Rate
7.97%
Mortgage Type
FHA
Estimated Equity
$189,186
Purchase Details
Closed on
Feb 21, 1998
Sold by
Bolte Richard E and Velky Shraron
Bought by
Bolte Richard E and Bolte Sharon K
Home Financials for this Owner
Home Financials are based on the most recent Mortgage that was taken out on this home.
Original Mortgage
$44,926
Interest Rate
6.91%
Mortgage Type
FHA
Purchase Details
Closed on
Mar 13, 1997
Sold by
Bolte Richard E
Bought by
Bolte Richard E and Velky Sharon K
Home Financials for this Owner
Home Financials are based on the most recent Mortgage that was taken out on this home.
Original Mortgage
$45,931
Interest Rate
7.65%
Mortgage Type
FHA
Create a Home Valuation Report for This Property
The Home Valuation Report is an in-depth analysis detailing your home's value as well as a comparison with similar homes in the area
Home Values in the Area
Average Home Value in this Area
Purchase History
| Date | Buyer | Sale Price | Title Company |
|---|---|---|---|
| White David Wayne | -- | Stewart Title | |
| Bolte Richard E | -- | -- | |
| Bolte Richard E | -- | -- |
Source: Public Records
Mortgage History
| Date | Status | Borrower | Loan Amount |
|---|---|---|---|
| Open | White David Wayne | $62,966 | |
| Previous Owner | Bolte Richard E | $44,926 | |
| Previous Owner | Bolte Richard E | $45,931 |
Source: Public Records
Tax History Compared to Growth
Tax History
| Year | Tax Paid | Tax Assessment Tax Assessment Total Assessment is a certain percentage of the fair market value that is determined by local assessors to be the total taxable value of land and additions on the property. | Land | Improvement |
|---|---|---|---|---|
| 2025 | $2,364 | $21,609 | $5,041 | $16,568 |
| 2024 | $2,364 | $28,977 | $5,231 | $23,746 |
| 2023 | $2,319 | $28,977 | $3,895 | $25,082 |
| 2022 | $1,479 | $16,340 | $5,634 | $10,706 |
| 2021 | $1,478 | $16,340 | $5,634 | $10,706 |
| 2020 | $1,378 | $15,501 | $5,634 | $9,867 |
| 2019 | $1,333 | $15,501 | $5,634 | $9,867 |
| 2018 | $1,359 | $15,220 | $3,116 | $12,104 |
| 2017 | $1,359 | $15,220 | $3,116 | $12,104 |
| 2016 | $1,322 | $14,839 | $2,603 | $12,236 |
| 2014 | $1,159 | $12,974 | $3,173 | $9,801 |
Source: Public Records
Map
Nearby Homes
- 2000 SW Smith St
- 505 SW 18th St
- 1700 SW Mc Arthur St
- 514 SW 15 St
- 701 SW 17th St
- 510 SW 12 St
- 209 SW 24th St
- 318 SW 10th St
- 503 NW 15th St
- 514 SW 10th St
- 404 SW 9th St
- 1812 NW Willowbrook Dr
- 1109 NW B St
- 804 NW North Summit Cir
- 1504 SW Sunset St
- 304 SW 7th Street Terrace
- 1001 SW 18th St
- 124 SW 27th St
- 1008 SW 17th St
- 2521 NW Richard Dr
- 1708 SW Walnut St
- 1704 SW Walnut St
- 1705 SW Walnut St
- 1800 SW Walnut St
- 1707 SW Walnut St
- 205 SW 17th St
- 1802 SW Walnut St
- 1705 SW Moore St
- 1801 SW Walnut St
- 1713 SW Moore St
- 203 SW 17th St
- 313 SW 18th Terrace
- 313 SW 18th Street Terrace
- 1706 SW Smith St
- 308 SW 18th Street Terrace
- 1608 SW Walnut St
- 1800 SW Smith St
- 1701 SW Moore St
- 1805 SW Walnut St
- 1808 SW Walnut St