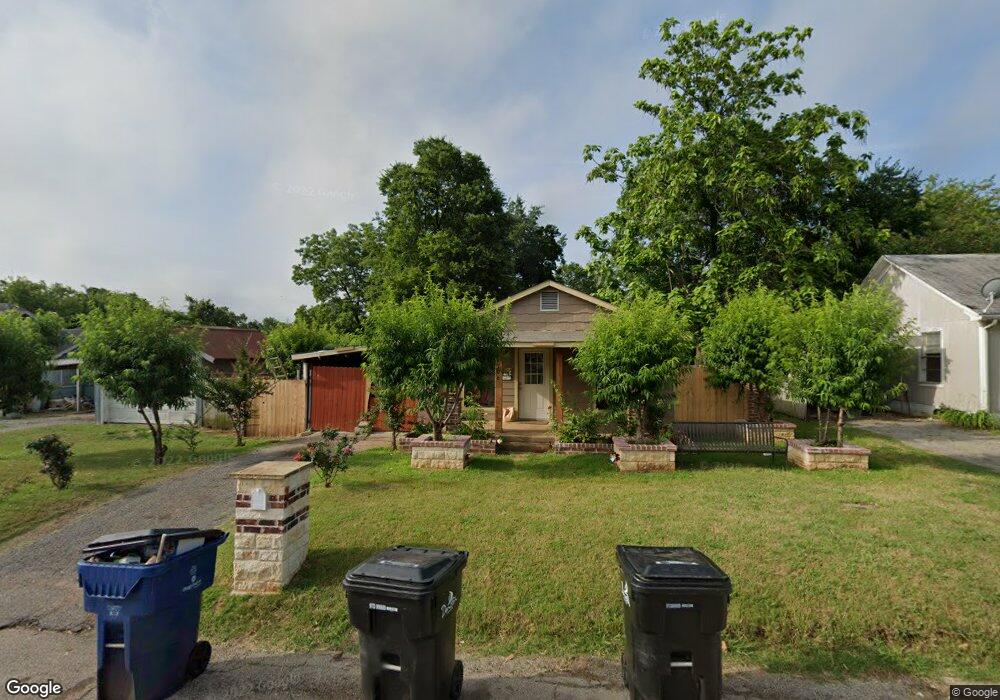
1706 W Johnson St Denison, TX 75020
Estimated Value: $129,060 - $139,000
Studio
--
Bath
946
Sq Ft
$142/Sq Ft
Est. Value
About This Home
This home is located at 1706 W Johnson St, Denison, TX 75020 and is currently estimated at $134,030, approximately $141 per square foot. 1706 W Johnson St is a home located in Grayson County with nearby schools including Mayes Elementary School, Scott Middle School, and Denison High School.
Ownership History
Date
Name
Owned For
Owner Type
Purchase Details
Closed on
Aug 21, 2015
Sold by
Rollins Michael R
Bought by
Arellano Velazquez Jose Serafin and Castillo Teresa Estrada
Current Estimated Value
Home Financials for this Owner
Home Financials are based on the most recent Mortgage that was taken out on this home.
Original Mortgage
$36,000
Interest Rate
4.08%
Mortgage Type
New Conventional
Purchase Details
Closed on
Jun 13, 2012
Sold by
Greenway Shirley
Bought by
Arellano Jose
Purchase Details
Closed on
Feb 16, 2007
Sold by
Brooks Lydia
Bought by
Mccrea Stephanie A and Mccrea Katherine N
Purchase Details
Closed on
Aug 27, 2004
Sold by
Brown Terrance Jay
Bought by
Greenway Shirley
Purchase Details
Closed on
Apr 20, 2004
Sold by
Vick Thelma W
Bought by
Brown Terence Jay
Create a Home Valuation Report for This Property
The Home Valuation Report is an in-depth analysis detailing your home's value as well as a comparison with similar homes in the area
Home Values in the Area
Average Home Value in this Area
Purchase History
| Date | Buyer | Sale Price | Title Company |
|---|---|---|---|
| Arellano Velazquez Jose Serafin | -- | None Available | |
| Arellano Jose | -- | None Available | |
| Mccrea Stephanie A | -- | None Available | |
| Greenway Shirley | -- | -- | |
| Brown Terence Jay | -- | -- |
Source: Public Records
Mortgage History
| Date | Status | Borrower | Loan Amount |
|---|---|---|---|
| Closed | Arellano Velazquez Jose Serafin | $36,000 |
Source: Public Records
Tax History
| Year | Tax Paid | Tax Assessment Tax Assessment Total Assessment is a certain percentage of the fair market value that is determined by local assessors to be the total taxable value of land and additions on the property. | Land | Improvement |
|---|---|---|---|---|
| 2025 | $2,614 | $111,073 | $43,125 | $67,948 |
| 2024 | $2,614 | $112,515 | $47,250 | $65,265 |
| 2023 | $2,267 | $100,081 | $40,875 | $59,206 |
| 2022 | $2,254 | $94,867 | $40,875 | $53,992 |
| 2021 | $1,647 | $65,305 | $20,250 | $45,055 |
| 2020 | $1,599 | $60,627 | $15,000 | $45,627 |
| 2019 | $1,656 | $60,197 | $12,450 | $47,747 |
| 2018 | $1,439 | $51,888 | $7,800 | $44,088 |
| 2017 | $1,615 | $57,714 | $6,975 | $50,739 |
| 2016 | $1,477 | $52,779 | $4,200 | $48,579 |
Source: Public Records
Map
Nearby Homes
- 1801 W Bond St
- 816 Leeper Dr
- 501 W Walker St
- 909 W Walker St
- 1728 W Washington St
- 1505 W Johnson St
- 2151 Juanita Dr
- 2900 W Morton St
- 3130 W Morton St
- 3030 W Morton St
- 3300 W Morton St
- TBD W Johnson St
- 1737 W Parnell St
- 1905 W Morton St Unit 5
- 1905 W Morton St Unit 20
- 1905 W Morton St Unit 6
- 1981 W Bond St
- 2425 Juanita Dr
- 2021 W Walker St
- 1140 Redbud St
- 1708 W Johnson St
- 715 N Bush Ave
- 1700 W Johnson St
- 1710 W Johnson St
- 1720 W Johnson St
- 1709 W Walker St
- 1705 W Walker St
- 1711 W Walker St
- 1701 W Walker St
- 1722 W Johnson St
- 1709 W Johnson St
- 1711 W Johnson St
- 1723 W Walker St
- 1630 W Johnson St
- 1713 W Johnson St
- 714 N Derby St Unit 102
- 1715 W Johnson St
- 805 N Bush Ave
- 1631 W Walker St
- 1729 W Walker St
Your Personal Tour Guide
Ask me questions while you tour the home.