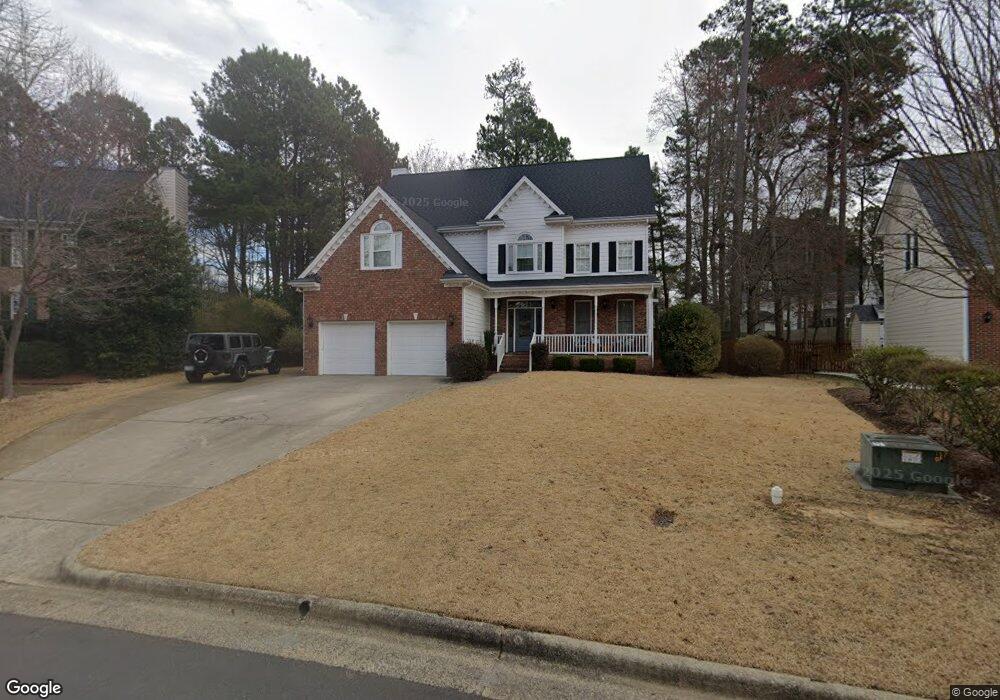
1706 Walden Meadow Dr Apex, NC 27523
Beaver Creek NeighborhoodEstimated Value: $733,000 - $765,537
5
Beds
3
Baths
3,246
Sq Ft
$229/Sq Ft
Est. Value
About This Home
This home is located at 1706 Walden Meadow Dr, Apex, NC 27523 and is currently estimated at $744,884, approximately $229 per square foot. 1706 Walden Meadow Dr is a home located in Wake County with nearby schools including Turner Creek Elementary School, Salem Middle, and Green Level High School.
Ownership History
Date
Name
Owned For
Owner Type
Purchase Details
Closed on
Dec 10, 2020
Sold by
Lounsbury Richard P and Lounsbury Laurel
Bought by
Maxwell Mary and Maxwell Kelly
Current Estimated Value
Home Financials for this Owner
Home Financials are based on the most recent Mortgage that was taken out on this home.
Original Mortgage
$454,400
Outstanding Balance
$404,552
Interest Rate
2.7%
Mortgage Type
New Conventional
Estimated Equity
$340,332
Purchase Details
Closed on
Oct 5, 2015
Sold by
Lounsbury Richard P
Bought by
Lounsbury Richard D and Lounsbury Laurel
Purchase Details
Closed on
Jun 15, 2000
Sold by
Crown Builders & Developers Inc
Bought by
Lounsbury Richard P
Home Financials for this Owner
Home Financials are based on the most recent Mortgage that was taken out on this home.
Original Mortgage
$177,000
Interest Rate
7%
Create a Home Valuation Report for This Property
The Home Valuation Report is an in-depth analysis detailing your home's value as well as a comparison with similar homes in the area
Home Values in the Area
Average Home Value in this Area
Purchase History
| Date | Buyer | Sale Price | Title Company |
|---|---|---|---|
| Maxwell Mary | $516,000 | None Available | |
| Lounsbury Richard D | -- | Attorney | |
| Lounsbury Richard P | $277,000 | -- |
Source: Public Records
Mortgage History
| Date | Status | Borrower | Loan Amount |
|---|---|---|---|
| Open | Maxwell Mary | $454,400 | |
| Previous Owner | Lounsbury Richard P | $177,000 |
Source: Public Records
Tax History Compared to Growth
Tax History
| Year | Tax Paid | Tax Assessment Tax Assessment Total Assessment is a certain percentage of the fair market value that is determined by local assessors to be the total taxable value of land and additions on the property. | Land | Improvement |
|---|---|---|---|---|
| 2025 | $6,065 | $692,409 | $220,000 | $472,409 |
| 2024 | $5,930 | $692,409 | $220,000 | $472,409 |
| 2023 | $4,856 | $435,975 | $85,000 | $350,975 |
| 2022 | $4,508 | $435,975 | $85,000 | $350,975 |
| 2021 | $4,336 | $435,975 | $85,000 | $350,975 |
| 2020 | $4,293 | $435,975 | $85,000 | $350,975 |
| 2019 | $4,502 | $394,657 | $80,000 | $314,657 |
| 2018 | $0 | $394,657 | $80,000 | $314,657 |
| 2017 | $0 | $394,657 | $80,000 | $314,657 |
| 2016 | $0 | $394,657 | $80,000 | $314,657 |
| 2015 | -- | $393,565 | $70,000 | $323,565 |
| 2014 | -- | $380,418 | $70,000 | $310,418 |
Source: Public Records
Map
Nearby Homes
- 2300 Walden Creek Dr
- 1622 Shepherds Glade Dr
- 1633 Shepherds Glade Dr
- 2208 Good Shepherd Way
- 2122 Grouse Ski Cir
- 2115 Grouse Ski Cir
- 2060 Jersey City Place
- 2134 Grouse Ski Cir
- 2127 Grouse Ski Cir
- 2201 Dial Dr
- 831 Tunisian Dr
- 2151 Grouse Ski Cir
- 7242 Morris Acres Rd
- 2013 Keokuk Ct
- 2126 Whitesmith Dr
- 1001 Drayman Place
- 1038 Brownsmith Dr
- 2007 Ackerman Hill Dr
- 709 Oak Ridge Dr
- 700 Oak Ridge Dr
- 1708 Walden Meadow Dr
- 1704 Walden Meadow Dr
- 1703 Green Hickory Ct
- 1704 Green Hickory Ct
- 1705 Walden Meadow Dr
- 1702 Walden Meadow Dr
- 2308 Walden Creek Dr
- 2306 Walden Creek Dr
- 1710 Walden Meadow Dr
- 2317 Bristers Spring Way
- 1709 Walden Meadow Dr
- 2315 Bristers Spring Way
- 1700 Walden Meadow Dr
- 1702 Green Hickory Ct
- 1703 Walden Meadow Dr
- 1701 Walden Meadow Dr
- 2312 Walden Creek Dr
- 2311 Bristers Spring Way
- 1700 Green Hickory Ct
- 2403 Bristers Spring Way