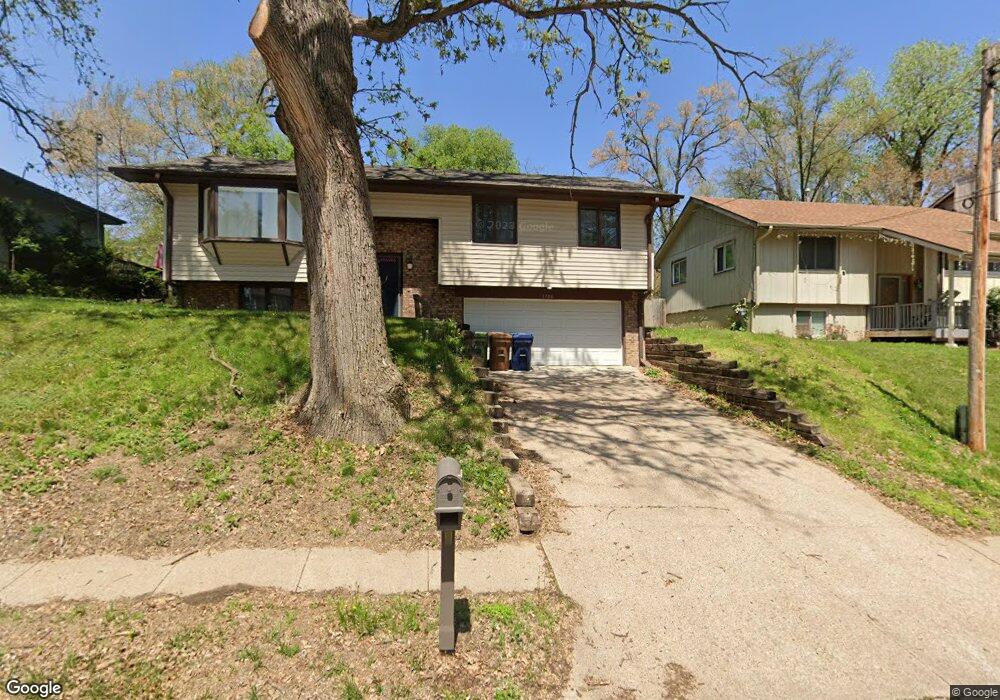
1706 Warren St Bellevue, NE 68005
Estimated Value: $252,000 - $268,000
3
Beds
3
Baths
1,226
Sq Ft
$209/Sq Ft
Est. Value
About This Home
This home is located at 1706 Warren St, Bellevue, NE 68005 and is currently estimated at $256,484, approximately $209 per square foot. 1706 Warren St is a home located in Sarpy County with nearby schools including Bertha Barber Elementary School, Bellevue Mission Middle School, and Bellevue East High School.
Ownership History
Date
Name
Owned For
Owner Type
Purchase Details
Closed on
Apr 21, 2022
Sold by
Miller and Blanca
Bought by
Rose Wyatt A
Current Estimated Value
Home Financials for this Owner
Home Financials are based on the most recent Mortgage that was taken out on this home.
Original Mortgage
$245,520
Outstanding Balance
$228,005
Interest Rate
4.16%
Mortgage Type
New Conventional
Estimated Equity
$28,479
Purchase Details
Closed on
Mar 9, 2019
Sold by
A L P Properties Llc
Bought by
Miller Thomas
Home Financials for this Owner
Home Financials are based on the most recent Mortgage that was taken out on this home.
Original Mortgage
$153,225
Interest Rate
4.3%
Mortgage Type
VA
Purchase Details
Closed on
Jun 20, 2011
Sold by
Peck Aaron and Peck Heather
Bought by
A L P Properties Llc
Purchase Details
Closed on
Sep 24, 2010
Sold by
Deutsche Bank National Trust Company
Bought by
Peck Aaron
Purchase Details
Closed on
Jun 22, 2010
Sold by
Jung Hazel Jr George A and Jung Johann Hazel Lucie
Bought by
Deutsche Bank National Trust Company
Create a Home Valuation Report for This Property
The Home Valuation Report is an in-depth analysis detailing your home's value as well as a comparison with similar homes in the area
Home Values in the Area
Average Home Value in this Area
Purchase History
| Date | Buyer | Sale Price | Title Company |
|---|---|---|---|
| Rose Wyatt A | $240,000 | Ambassador Title Services | |
| Miller Thomas | $150,000 | Encompass Title & Escrow Llc | |
| A L P Properties Llc | $80,000 | Midwest Title Omaha | |
| Peck Aaron | $66,000 | Nebraska Default & Title Ser | |
| Deutsche Bank National Trust Company | $93,500 | None Available |
Source: Public Records
Mortgage History
| Date | Status | Borrower | Loan Amount |
|---|---|---|---|
| Open | Rose Wyatt A | $245,520 | |
| Previous Owner | Miller Thomas | $153,225 |
Source: Public Records
Tax History
| Year | Tax Paid | Tax Assessment Tax Assessment Total Assessment is a certain percentage of the fair market value that is determined by local assessors to be the total taxable value of land and additions on the property. | Land | Improvement |
|---|---|---|---|---|
| 2025 | $3,873 | $239,000 | $43,000 | $196,000 |
| 2024 | $4,247 | $221,611 | $39,000 | $182,611 |
| 2023 | $4,247 | $201,144 | $36,000 | $165,144 |
| 2022 | $3,487 | $162,035 | $31,000 | $131,035 |
| 2021 | $3,262 | $149,986 | $28,000 | $121,986 |
| 2020 | $3,188 | $146,076 | $28,000 | $118,076 |
| 2019 | $2,944 | $135,763 | $26,000 | $109,763 |
| 2018 | $2,641 | $125,075 | $26,000 | $99,075 |
| 2017 | $2,727 | $128,258 | $26,000 | $102,258 |
| 2016 | $2,560 | $123,036 | $26,000 | $97,036 |
| 2015 | $2,530 | $122,337 | $26,000 | $96,337 |
| 2014 | $2,501 | $120,138 | $26,000 | $94,138 |
| 2012 | -- | $118,540 | $26,000 | $92,540 |
Source: Public Records
Map
Nearby Homes
- 104 Waldo Cir
- 1801 Hancock St
- 1908 Warren St
- 406 Robinson Ave
- 2004 Main St
- 1701 Jefferson St
- 2001 Jackson St
- 411 W 22nd Ave
- 2010 Jackson St
- 1405 Freeman Dr
- 1807 Collins Dr
- 2303 Madison St
- 2519 Hancock St
- 2510 Franklin St
- 420 Waldruh Dr
- 2504 Washington St
- 2411 Madison St
- 2306 Jackson St
- 2406 Madison St
- 2509 Madison St
- 1706 Warren St
- 1708 Warren St
- 1704 Warren St
- 321 E 17th Ave
- 1710 Warren St
- 1709 Warren St
- 1711 Warren St
- 319 E 17th Ave
- 1705 Warren St
- 1702 Warren St
- 317 E 17th Bellevue Ave
- 317 E 17th Ave
- 315 E 17th Ave
- 1713 Warren St
- 313 E 17th Ave
- 311 E 17th Ave
- 1701 Warren St
- 311 E 17th Ave
- 1610 Warren St
- 1701 Warren St
Your Personal Tour Guide
Ask me questions while you tour the home.