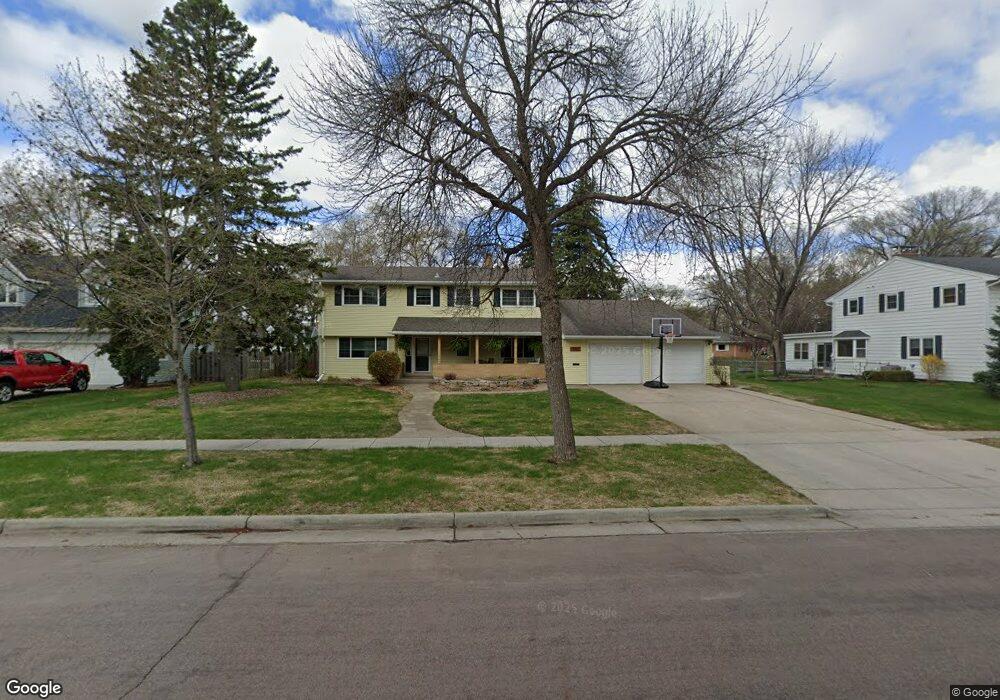
1707 7th St S Fargo, ND 58103
Clara Barton NeighborhoodEstimated Value: $461,769 - $550,000
4
Beds
3
Baths
2,658
Sq Ft
$186/Sq Ft
Est. Value
About This Home
This home is located at 1707 7th St S, Fargo, ND 58103 and is currently estimated at $494,942, approximately $186 per square foot. 1707 7th St S is a home located in Cass County with nearby schools including Clara Barton Elementary School, Carl Ben Eielson Middle School, and South High School.
Ownership History
Date
Name
Owned For
Owner Type
Purchase Details
Closed on
Jun 16, 2008
Sold by
Lovell Gerald D and Lovell Robeta L
Bought by
Mahli Dan M and Mahli Kim D
Current Estimated Value
Home Financials for this Owner
Home Financials are based on the most recent Mortgage that was taken out on this home.
Original Mortgage
$199,999
Outstanding Balance
$128,339
Interest Rate
6.05%
Mortgage Type
New Conventional
Estimated Equity
$366,603
Create a Home Valuation Report for This Property
The Home Valuation Report is an in-depth analysis detailing your home's value as well as a comparison with similar homes in the area
Home Values in the Area
Average Home Value in this Area
Purchase History
| Date | Buyer | Sale Price | Title Company |
|---|---|---|---|
| Mahli Dan M | -- | -- |
Source: Public Records
Mortgage History
| Date | Status | Borrower | Loan Amount |
|---|---|---|---|
| Open | Mahli Dan M | $199,999 |
Source: Public Records
Tax History
| Year | Tax Paid | Tax Assessment Tax Assessment Total Assessment is a certain percentage of the fair market value that is determined by local assessors to be the total taxable value of land and additions on the property. | Land | Improvement |
|---|---|---|---|---|
| 2024 | $6,361 | $220,900 | $45,000 | $175,900 |
| 2023 | $6,293 | $200,800 | $45,000 | $155,800 |
| 2022 | $5,842 | $180,900 | $45,000 | $135,900 |
| 2021 | $5,890 | $186,050 | $50,300 | $135,750 |
| 2020 | $5,825 | $186,050 | $50,300 | $135,750 |
| 2019 | $5,508 | $173,900 | $31,450 | $142,450 |
| 2018 | $5,037 | $158,050 | $31,450 | $126,600 |
| 2017 | $4,858 | $152,800 | $31,450 | $121,350 |
| 2016 | $4,428 | $148,400 | $31,450 | $116,950 |
| 2015 | $4,320 | $134,850 | $21,400 | $113,450 |
| 2014 | $4,094 | $128,400 | $21,400 | $107,000 |
| 2013 | $4,274 | $122,700 | $21,400 | $101,300 |
Source: Public Records
Map
Nearby Homes
- 1707 5th St S
- 1550 8th St S
- 1502 8th St S
- 645 21st Ave S Unit 3
- 337 Elmwood Ave S
- 1605 14th St S
- 1301 10th St S
- 1834 14 1 2 St S
- 1416 14 1 2 St S
- 1410 14 1 2 St S
- 1329 14th St S
- 1112 University Dr S
- 326 10th Ave S Unit 2
- 911 8th St S
- 1526 16 1 2 St S
- 1119 Elm St S
- 320 22nd Ave S
- 4813 4th St S
- 4817 4th St S
- 4825 4th St S
Your Personal Tour Guide
Ask me questions while you tour the home.