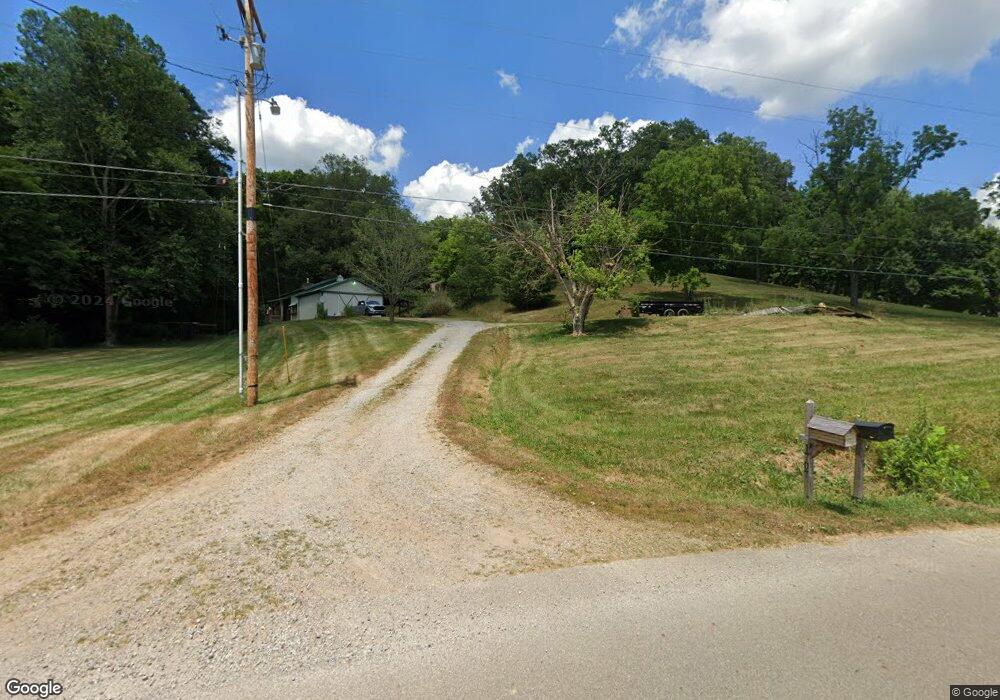
1707 Alma Omega Rd Waverly, OH 45690
Estimated Value: $150,000 - $178,000
2
Beds
1
Bath
672
Sq Ft
$247/Sq Ft
Est. Value
About This Home
This home is located at 1707 Alma Omega Rd, Waverly, OH 45690 and is currently estimated at $165,739, approximately $246 per square foot. 1707 Alma Omega Rd is a home located in Pike County with nearby schools including Waverly Primary School, Waverly Intermediate School, and Waverly Junior High School.
Ownership History
Date
Name
Owned For
Owner Type
Purchase Details
Closed on
Mar 10, 2025
Sold by
Rowe Tyler
Bought by
Howard Jeffrey Lee and Howard Laurie Ann
Current Estimated Value
Purchase Details
Closed on
Apr 5, 2019
Sold by
Benson Chad and Benson Hilary
Bought by
Rowe Tyler
Home Financials for this Owner
Home Financials are based on the most recent Mortgage that was taken out on this home.
Original Mortgage
$136,700
Interest Rate
4.3%
Mortgage Type
New Conventional
Purchase Details
Closed on
Apr 25, 2015
Sold by
Pack Jesse P
Bought by
Benson Chad and Benson Hilary
Home Financials for this Owner
Home Financials are based on the most recent Mortgage that was taken out on this home.
Original Mortgage
$134,027
Interest Rate
3.77%
Mortgage Type
FHA
Purchase Details
Closed on
Nov 29, 2013
Sold by
Howard Jeffrey Lee and Howard Laurie Ann
Bought by
Pack Jesse P
Create a Home Valuation Report for This Property
The Home Valuation Report is an in-depth analysis detailing your home's value as well as a comparison with similar homes in the area
Home Values in the Area
Average Home Value in this Area
Purchase History
| Date | Buyer | Sale Price | Title Company |
|---|---|---|---|
| Howard Jeffrey Lee | $144,000 | None Listed On Document | |
| Howard Jeffrey Lee | $144,000 | None Listed On Document | |
| Rowe Tyler | $143,900 | None Available | |
| Benson Chad | $137,000 | None Available | |
| Pack Jesse P | $123,000 | None Available |
Source: Public Records
Mortgage History
| Date | Status | Borrower | Loan Amount |
|---|---|---|---|
| Previous Owner | Rowe Tyler | $136,700 | |
| Previous Owner | Benson Chad | $134,027 | |
| Closed | Pack Jesse P | $0 |
Source: Public Records
Tax History Compared to Growth
Tax History
| Year | Tax Paid | Tax Assessment Tax Assessment Total Assessment is a certain percentage of the fair market value that is determined by local assessors to be the total taxable value of land and additions on the property. | Land | Improvement |
|---|---|---|---|---|
| 2024 | $1,666 | $49,390 | $11,650 | $37,740 |
| 2023 | $1,666 | $49,390 | $11,650 | $37,740 |
| 2022 | $1,736 | $44,500 | $8,400 | $36,100 |
| 2021 | $1,701 | $44,500 | $8,400 | $36,100 |
| 2020 | $1,707 | $44,500 | $8,400 | $36,100 |
| 2019 | $1,532 | $40,450 | $7,630 | $32,820 |
| 2018 | $1,341 | $40,450 | $7,630 | $32,820 |
| 2017 | $1,683 | $45,260 | $7,740 | $37,520 |
| 2016 | $1,148 | $29,230 | $4,590 | $24,640 |
| 2015 | $1,149 | $29,230 | $4,590 | $24,640 |
| 2014 | $1,143 | $29,230 | $4,590 | $24,640 |
| 2013 | $1,152 | $29,230 | $4,590 | $24,640 |
| 2012 | -- | $29,230 | $4,590 | $24,640 |
Source: Public Records
Map
Nearby Homes
- 361 Gee Hollow Rd
- 571 Alma Omega Rd
- 3050 Wilson Run Rd
- 300 Woods Hollow Rd
- 182 Gullion Ln
- 167 Mill Run
- 178 #14 Mill Run
- 1799 Woods Hollow Rd
- 25414 Ohio 335
- 1255 Higby Rd Unit 197732
- 4003 Prussia Rd
- 182 Columbia Dr
- 4001 Prussia Rd
- 0 Prussia Rd
- 422 Gordon Ave
- 402 Gordon Ave
- 612 Salisbury Rd
- 403 Gordon Ave
- 302 Beverly Ave
- 310 Beverly Ave
- 1669 Alma Omega Rd
- 7 Back Hollow Rd
- 1239 Alma Omega Rd Unit C41
- Lot 2 Alma Omega Rd
- Lot 1 Alma Omega Rd
- 0 Alma Omega Rd
- 00 Alma Omega Rd
- 000 Alma Omega Rd
- 1787 Alma Omega Rd
- 120 Back Hollow Rd Unit 210275
- 1969 Alma Omega Rd
- 1331 Alma Omega Rd
- 2084 Alma Omega Rd
- 1821 Alma Omega Rd
- 1261 Alma Omega Rd
- 2086 Alma Omega Rd
- 1259 Alma Omega Rd
- 1217 Alma Omega Rd
- 2185 Alma Omega Rd
- 2185 Alma Omega Rd