Estimated Value: $67,801 - $144,000
--
Bed
1
Bath
888
Sq Ft
$117/Sq Ft
Est. Value
About This Home
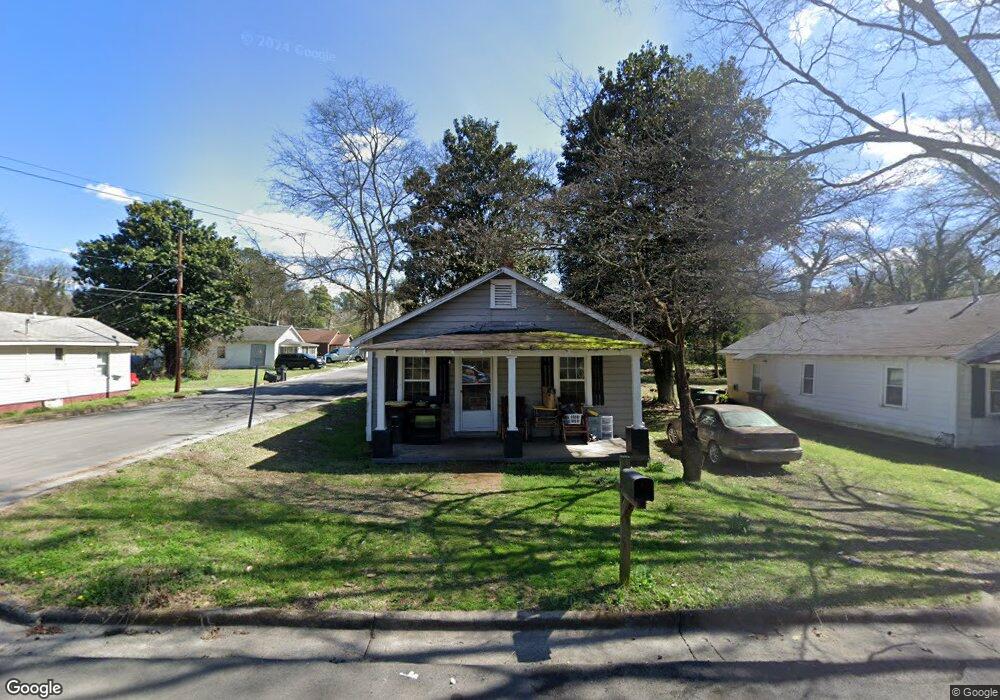
This home is located at 1707 Flannery St SW, Rome, GA 30161 and is currently estimated at $104,200, approximately $117 per square foot. 1707 Flannery St SW is a home located in Floyd County with nearby schools including Dan McCarty Middle School, Rome High School, and Darlington School.
Ownership History
Date
Name
Owned For
Owner Type
Purchase Details
Closed on
Jan 15, 2021
Sold by
Harper Kelvin
Bought by
Wade Paul
Current Estimated Value
Purchase Details
Closed on
Mar 4, 2011
Sold by
Greater Rome Bank
Bought by
Wade Paul
Home Financials for this Owner
Home Financials are based on the most recent Mortgage that was taken out on this home.
Original Mortgage
$5,983
Interest Rate
4.77%
Mortgage Type
Purchase Money Mortgage
Purchase Details
Closed on
Aug 3, 2010
Sold by
Garrett Bobbie L
Bought by
Greater Rome Bank
Purchase Details
Closed on
Dec 18, 1995
Sold by
Garrett Edward
Bought by
Garrett Bobbie L
Purchase Details
Closed on
Dec 4, 1995
Sold by
Kelley Jimmy
Bought by
Garrett Edward
Purchase Details
Closed on
Nov 1, 1993
Sold by
Isom Mary Agnes Scott Isom Mary Agn
Bought by
Kelley Jimmy
Purchase Details
Closed on
Oct 9, 1980
Sold by
Scott Frances O Arene and Thomas Scott Fra
Bought by
Isom Mary Agnes Scott Isom Mary Agn
Purchase Details
Closed on
Jan 1, 1901
Bought by
Scott Frances O Arene and Thomas Scot
Create a Home Valuation Report for This Property
The Home Valuation Report is an in-depth analysis detailing your home's value as well as a comparison with similar homes in the area
Home Values in the Area
Average Home Value in this Area
Purchase History
| Date | Buyer | Sale Price | Title Company |
|---|---|---|---|
| Wade Paul | -- | -- | |
| Wade Paul | $6,500 | -- | |
| Greater Rome Bank | -- | -- | |
| Garrett Bobbie L | -- | -- | |
| Garrett Edward | $5,000 | -- | |
| Kelley Jimmy | $12,000 | -- | |
| Isom Mary Agnes Scott Isom Mary Agn | -- | -- | |
| Scott Frances O Arene | -- | -- |
Source: Public Records
Mortgage History
| Date | Status | Borrower | Loan Amount |
|---|---|---|---|
| Previous Owner | Greater Rome Bank | $5,983 |
Source: Public Records
Tax History Compared to Growth
Tax History
| Year | Tax Paid | Tax Assessment Tax Assessment Total Assessment is a certain percentage of the fair market value that is determined by local assessors to be the total taxable value of land and additions on the property. | Land | Improvement |
|---|---|---|---|---|
| 2024 | $565 | $15,800 | $2,760 | $13,040 |
| 2023 | $560 | $13,028 | $2,794 | $10,234 |
| 2022 | $475 | $13,028 | $2,794 | $10,234 |
| 2021 | $411 | $13,029 | $3,072 | $9,957 |
| 2020 | $438 | $11,701 | $2,400 | $9,301 |
| 2019 | $423 | $11,423 | $2,400 | $9,023 |
| 2018 | $394 | $10,652 | $2,400 | $8,252 |
| 2017 | $379 | $10,232 | $2,400 | $7,832 |
| 2016 | $361 | $9,714 | $2,400 | $7,314 |
| 2015 | $341 | $9,714 | $2,400 | $7,314 |
| 2014 | $341 | $9,714 | $2,400 | $7,314 |
Source: Public Records
Map
Nearby Homes
- 414 E 17th St SW
- 1705 Olmstead St SW
- 1502 Spring Creek St SW
- 4 E 15th St SW
- 000 E Oglethorpe Hwy
- 304 E 19th St SW
- 39 E 16th St SW
- 111 Hosea St SW
- 14 Clover St SW
- 2014 Maple Ave SW
- 1901 Hull Ave SW
- 1314 E 2nd Ave SE
- 2512 Callier Springs Rd SE
- 106 E 14th St SW
- 2108 Maple Ave SW
- 13 Townview Rd SE
- 31 Notasulga Dr SW
- 170 E 11th St SW
- 168 E 11th St SE
- 1709 Flannery St SW
- 1705 Flannery St SW
- 1711 Flannery St SW
- 504 King St SW
- 1703 Flannery St SW
- 505 King St SW
- 1713 Flannery St SW
- 416 E 17th St SW
- 506 King St SW
- 507 King St SW
- 1702 Flannery St SW
- 508 King St SW
- 1801 Flannery St SW
- 1801 Flannery St SW
- 1704 Flannery St SW
- 509 King St SW
- 509 King St SW
- 1615 Flannery St SW
- 415 E 18th St SW
- 415 E 18th St SW