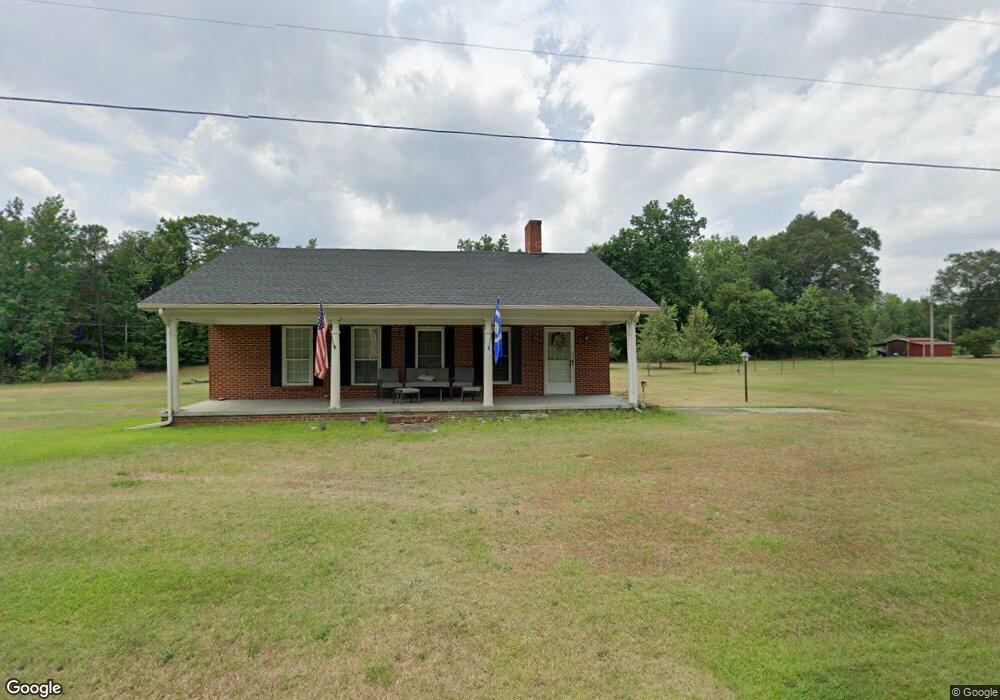
1707 Sandhill Game Mgnt Rd Rockingham, NC 28379
Estimated Value: $243,000 - $345,000
--
Bed
--
Bath
2,008
Sq Ft
$141/Sq Ft
Est. Value
About This Home
This home is located at 1707 Sandhill Game Mgnt Rd, Rockingham, NC 28379 and is currently estimated at $283,631, approximately $141 per square foot. 1707 Sandhill Game Mgnt Rd is a home with nearby schools including Mineral Springs Elementary School, Ellerbe Middle School, and Ashley Chapel Educational Center.
Ownership History
Date
Name
Owned For
Owner Type
Purchase Details
Closed on
Jan 19, 2024
Sold by
Unknown
Bought by
Rhinard Keith J
Current Estimated Value
Home Financials for this Owner
Home Financials are based on the most recent Mortgage that was taken out on this home.
Original Mortgage
$218,701
Outstanding Balance
$214,874
Interest Rate
6.95%
Mortgage Type
VA
Estimated Equity
$68,757
Purchase Details
Closed on
Apr 13, 2017
Sold by
Rhinard Keith J and Rhinard Gladye E
Bought by
Rhinard Keith J
Purchase Details
Closed on
Jun 22, 2010
Sold by
Powell Thomas W and Powell Bettina T
Bought by
Rhinard Keith J and Rhinard Gladys E
Home Financials for this Owner
Home Financials are based on the most recent Mortgage that was taken out on this home.
Original Mortgage
$148,117
Interest Rate
4.97%
Mortgage Type
VA
Create a Home Valuation Report for This Property
The Home Valuation Report is an in-depth analysis detailing your home's value as well as a comparison with similar homes in the area
Home Values in the Area
Average Home Value in this Area
Purchase History
| Date | Buyer | Sale Price | Title Company |
|---|---|---|---|
| Rhinard Keith J | -- | None Listed On Document | |
| Rhinard Keith J | -- | None Available | |
| Rhinard Keith J | $145,000 | -- |
Source: Public Records
Mortgage History
| Date | Status | Borrower | Loan Amount |
|---|---|---|---|
| Open | Rhinard Keith J | $218,701 | |
| Previous Owner | Rhinard Keith J | $148,117 |
Source: Public Records
Tax History Compared to Growth
Tax History
| Year | Tax Paid | Tax Assessment Tax Assessment Total Assessment is a certain percentage of the fair market value that is determined by local assessors to be the total taxable value of land and additions on the property. | Land | Improvement |
|---|---|---|---|---|
| 2025 | $1,640 | $192,849 | $36,926 | $155,923 |
| 2024 | $1,678 | $192,849 | $36,926 | $155,923 |
| 2023 | $1,369 | $137,571 | $23,735 | $113,836 |
| 2022 | $1,369 | $137,571 | $23,735 | $113,836 |
| 2021 | $1,365 | $137,571 | $23,735 | $113,836 |
| 2020 | $1,361 | $137,571 | $23,735 | $113,836 |
| 2019 | $1,335 | $137,571 | $23,735 | $113,836 |
| 2018 | $1,335 | $137,571 | $23,735 | $113,836 |
| 2016 | $1,276 | $137,571 | $23,735 | $113,836 |
| 2014 | -- | $118,555 | $16,287 | $102,268 |
Source: Public Records
Map
Nearby Homes
- 0 Anna McKinley
- 0 Ledbetter Rd
- 427 Green Lake Rd
- 8 Country
- 7 Country
- 116 American Legion Rd
- 112 American Legion Rd
- 156 Roberdel School Rd
- 0 Kenric Unit 100533178
- 0 Terry Bridge Rd
- 130 Lakeside Dr
- 265 Ledbetter Rd
- Tbd Loch Laurin Ln
- 0 Loch Laurin Ln
- 0 Creek Run Unit 100336089
- 194 Beane Run
- 115 Creek Run Ln
- 12 Beane
- 0 Country Club Dr
- 122 McDonald Church Rd
- 1457 Beaverdam Church Rd
- 1452 Beaverdam Church Rd
- 1460 Beaverdam Church Rd
- 1492 Beaverdam Church Rd
- 153 Anna McKinley Rd
- 1568 Sandhill Game Mgnt Rd
- 1548 Sandhill Game Mgnt Rd
- 1611 Sandhill Game Mgnt Rd
- 1193 Ledbetter Rd
- 1549 Sandhill Game Mgnt Rd
- 1529 Sandhill Game Mgnt Rd
- 1509 Sandhill Game Mgnt Rd
- 1182 Beaverdam Church Rd
- 1649 Sandhill Game Mgnt Rd
- 1677 Sandhill Game Mgnt Rd
- 1692 Sandhill Game Mgnt Rd
- Tba Sandhill Game Management Rd