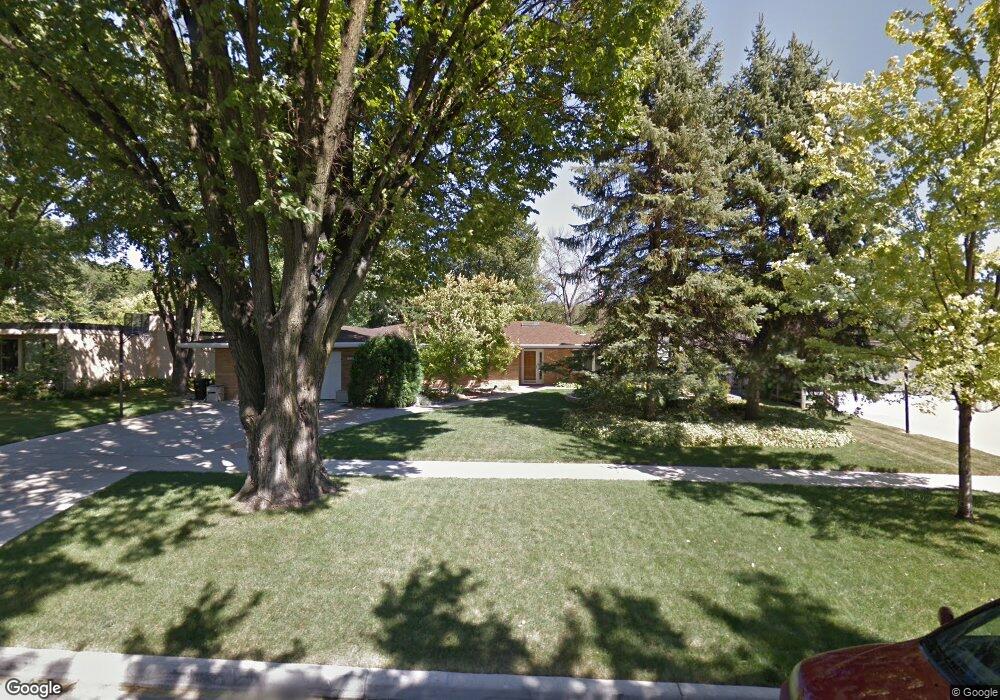
1708 9th St S Fargo, ND 58103
Clara Barton NeighborhoodEstimated Value: $442,000 - $777,000
--
Bed
--
Bath
2,519
Sq Ft
$221/Sq Ft
Est. Value
About This Home
This home is located at 1708 9th St S, Fargo, ND 58103 and is currently estimated at $557,229, approximately $221 per square foot. 1708 9th St S is a home located in Cass County with nearby schools including Clara Barton Elementary School, Carl Ben Eielson Middle School, and South High School.
Ownership History
Date
Name
Owned For
Owner Type
Purchase Details
Closed on
May 27, 2020
Sold by
Strand Jonathan A and Strand Erin R
Bought by
Sharbono Douglas B and Sharbono Kristin R
Current Estimated Value
Home Financials for this Owner
Home Financials are based on the most recent Mortgage that was taken out on this home.
Original Mortgage
$414,274
Outstanding Balance
$367,907
Interest Rate
3.3%
Mortgage Type
VA
Estimated Equity
$189,322
Purchase Details
Closed on
Aug 30, 2012
Sold by
Hoffelt Gregory G and Hoffelt Dorothy L
Bought by
Strand Jonathan A and Strand Erin R
Home Financials for this Owner
Home Financials are based on the most recent Mortgage that was taken out on this home.
Original Mortgage
$280,000
Interest Rate
3.52%
Mortgage Type
New Conventional
Purchase Details
Closed on
Nov 3, 2006
Sold by
Hoffelt Drothy L
Bought by
Hoffelt Greogory G and Hoffelt Dorothy L
Create a Home Valuation Report for This Property
The Home Valuation Report is an in-depth analysis detailing your home's value as well as a comparison with similar homes in the area
Home Values in the Area
Average Home Value in this Area
Purchase History
| Date | Buyer | Sale Price | Title Company |
|---|---|---|---|
| Sharbono Douglas B | $429,000 | Fm Title | |
| Strand Jonathan A | $350,000 | None Available | |
| Hoffelt Greogory G | -- | -- |
Source: Public Records
Mortgage History
| Date | Status | Borrower | Loan Amount |
|---|---|---|---|
| Open | Sharbono Douglas B | $414,274 | |
| Previous Owner | Strand Jonathan A | $280,000 |
Source: Public Records
Tax History Compared to Growth
Tax History
| Year | Tax Paid | Tax Assessment Tax Assessment Total Assessment is a certain percentage of the fair market value that is determined by local assessors to be the total taxable value of land and additions on the property. | Land | Improvement |
|---|---|---|---|---|
| 2024 | $6,432 | $256,800 | $43,350 | $213,450 |
| 2023 | $6,419 | $240,000 | $43,350 | $196,650 |
| 2022 | $5,879 | $216,200 | $43,350 | $172,850 |
| 2021 | $5,779 | $216,450 | $45,250 | $171,200 |
| 2020 | $5,703 | $216,450 | $45,250 | $171,200 |
| 2019 | $5,335 | $202,300 | $28,300 | $174,000 |
| 2018 | $5,265 | $202,300 | $28,300 | $174,000 |
| 2017 | $5,057 | $196,400 | $28,300 | $168,100 |
| 2016 | $4,504 | $190,700 | $28,300 | $162,400 |
| 2015 | $4,418 | $175,800 | $19,250 | $156,550 |
| 2014 | $4,196 | $162,800 | $19,250 | $143,550 |
| 2013 | $4,200 | $162,800 | $19,250 | $143,550 |
Source: Public Records
Map
Nearby Homes
- 1439 10th St S
- 1550 13 1 2 St S
- 1425 11th St S
- 1710 14th St S
- 1361 16th Ave S
- 1550 14 1 2 St S
- 1834 14 1 2 St S
- 1718 15th St S
- 1301 10th St S
- 1545 15th St S
- 1208 University Dr S
- 1314 14th St S
- 2309 9th St S
- 1124 University Dr S
- 1112 University Dr S
- 1418 12th Ave S
- 403 11th Ave S Unit 2
- 911 8th St S
- 1838 17th St S
- 1917 16 1 2 St S