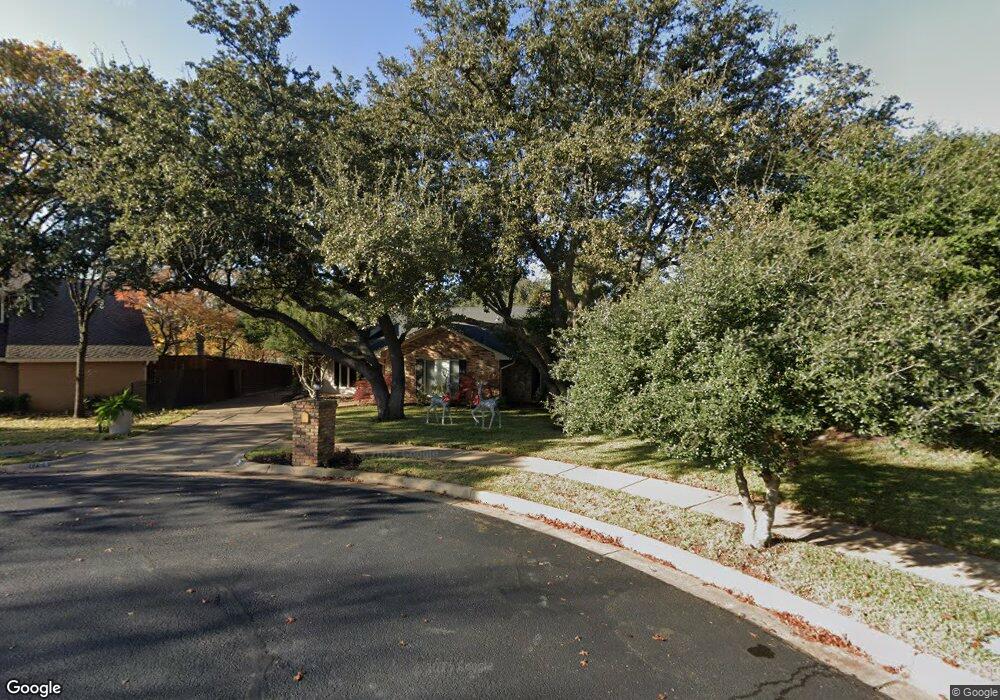
1708 Ashbury Ct Bedford, TX 76021
Estimated Value: $616,000 - $674,000
4
Beds
3
Baths
3,353
Sq Ft
$192/Sq Ft
Est. Value
About This Home
This home is located at 1708 Ashbury Ct, Bedford, TX 76021 and is currently estimated at $643,494, approximately $191 per square foot. 1708 Ashbury Ct is a home located in Tarrant County with nearby schools including Spring Garden Elementary School, Harwood Junior High School, and Trinity High School.
Ownership History
Date
Name
Owned For
Owner Type
Purchase Details
Closed on
Jul 25, 2016
Sold by
Short Augden W and Short Joan T
Bought by
Pearcy Shuan D and Pearcy Amanda L
Current Estimated Value
Home Financials for this Owner
Home Financials are based on the most recent Mortgage that was taken out on this home.
Original Mortgage
$340,506
Outstanding Balance
$271,123
Interest Rate
3.5%
Mortgage Type
FHA
Estimated Equity
$372,371
Purchase Details
Closed on
Jun 1, 2007
Sold by
Mining James Randy and Mining Linda Sue Lucky
Bought by
Short Augden W and Short Joan T
Home Financials for this Owner
Home Financials are based on the most recent Mortgage that was taken out on this home.
Original Mortgage
$231,000
Interest Rate
6.16%
Mortgage Type
Purchase Money Mortgage
Create a Home Valuation Report for This Property
The Home Valuation Report is an in-depth analysis detailing your home's value as well as a comparison with similar homes in the area
Home Values in the Area
Average Home Value in this Area
Purchase History
| Date | Buyer | Sale Price | Title Company |
|---|---|---|---|
| Pearcy Shuan D | -- | Itc | |
| Short Augden W | -- | Hexter Fair Title Company |
Source: Public Records
Mortgage History
| Date | Status | Borrower | Loan Amount |
|---|---|---|---|
| Open | Pearcy Shuan D | $340,506 | |
| Previous Owner | Short Augden W | $231,000 |
Source: Public Records
Tax History Compared to Growth
Tax History
| Year | Tax Paid | Tax Assessment Tax Assessment Total Assessment is a certain percentage of the fair market value that is determined by local assessors to be the total taxable value of land and additions on the property. | Land | Improvement |
|---|---|---|---|---|
| 2025 | $11,328 | $581,837 | $130,000 | $451,837 |
| 2024 | $11,328 | $581,837 | $130,000 | $451,837 |
| 2023 | $11,547 | $602,040 | $90,000 | $512,040 |
| 2022 | $11,020 | $504,530 | $90,000 | $414,530 |
| 2021 | $9,428 | $400,241 | $90,000 | $310,241 |
| 2020 | $9,578 | $402,848 | $90,000 | $312,848 |
| 2019 | $9,906 | $407,761 | $90,000 | $317,761 |
| 2018 | $8,796 | $362,090 | $90,000 | $272,090 |
| 2017 | $9,810 | $405,529 | $50,000 | $355,529 |
| 2016 | $9,380 | $387,755 | $50,000 | $337,755 |
| 2015 | $6,380 | $374,261 | $50,000 | $324,261 |
| 2014 | $6,380 | $339,600 | $35,000 | $304,600 |
Source: Public Records
Map
Nearby Homes
- 1800 Hampton Dr
- 1820 Wimbleton Dr
- 3827 Ashbury Ln
- 1209 Hillandale Ct
- 3301 Wendover Ct
- 1136 Wingate Dr
- 1636 Bedford Oaks Dr
- 3513 Meadowside Dr
- 1704 Indian Oaks Ct
- 3532 Meadowside Dr
- 3907 Windermere Dr
- 1109 Simpson Terrace
- 2209 Laurel Ct
- 1401 Danielle Dr
- 3840 Edgewater Dr
- 1421 Plantation Dr N
- 1723 Post Oak Dr
- 1303 Crest Dr
- 2901 Miles Way
- 3813 Brookridge Ct
- 1712 Ashbury Ct
- 1704 Ashbury Ct
- 4 Country Place
- 6 Country Place
- 1716 Ashbury Ct
- 1701 Hampton Ct
- 1700 Ashbury Ct
- 1709 Ashbury Ct
- 2 Country Place
- 1705 Hampton Ct
- 1720 Ashbury Ct
- 8 Country Place
- 1701 Ashbury Ct
- 1709 Hampton Ct
- 1713 Ashbury Ct
- 1724 Ashbury Ct
- 11 Country Place
- 3 Country Place
- 10 Country Place
- 1704 Hampton Ct