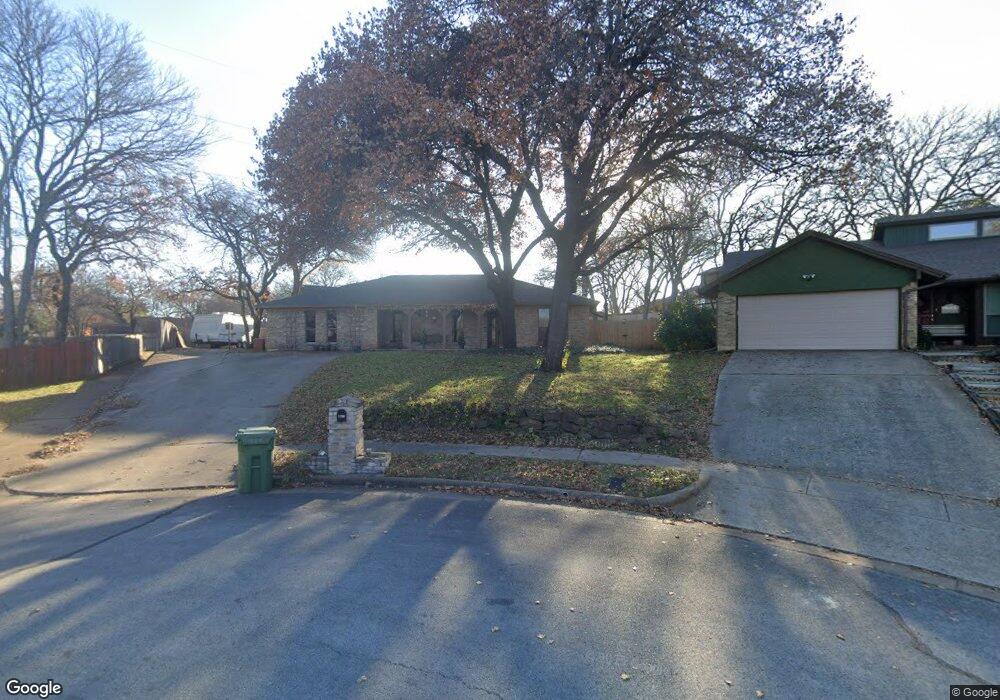
1708 Bedford Oaks Ct Bedford, TX 76021
Estimated Value: $417,000 - $433,917
3
Beds
3
Baths
2,095
Sq Ft
$204/Sq Ft
Est. Value
About This Home
This home is located at 1708 Bedford Oaks Ct, Bedford, TX 76021 and is currently estimated at $427,229, approximately $203 per square foot. 1708 Bedford Oaks Ct is a home located in Tarrant County with nearby schools including Spring Garden Elementary School, Harwood Junior High School, and Trinity High School.
Ownership History
Date
Name
Owned For
Owner Type
Purchase Details
Closed on
Dec 6, 2007
Sold by
Smith Jack Anthony and Smith Sonya Lea
Bought by
Smotherman John S and Smotherman Cynthia Sue
Current Estimated Value
Home Financials for this Owner
Home Financials are based on the most recent Mortgage that was taken out on this home.
Original Mortgage
$153,772
Outstanding Balance
$97,180
Interest Rate
6.27%
Mortgage Type
Purchase Money Mortgage
Estimated Equity
$330,049
Purchase Details
Closed on
Dec 25, 2001
Sold by
Lambert Vickie Denise and Lambert David Caswell
Bought by
Smith Jack Anthony
Purchase Details
Closed on
Nov 26, 1996
Sold by
Vanhooser Ronald Lynn and Vanhooser Linda D
Bought by
Smith Jack Anthony and Smith Vickie Denise
Home Financials for this Owner
Home Financials are based on the most recent Mortgage that was taken out on this home.
Original Mortgage
$104,500
Interest Rate
7.9%
Create a Home Valuation Report for This Property
The Home Valuation Report is an in-depth analysis detailing your home's value as well as a comparison with similar homes in the area
Home Values in the Area
Average Home Value in this Area
Purchase History
| Date | Buyer | Sale Price | Title Company |
|---|---|---|---|
| Smotherman John S | -- | Hexter Fair Title Company | |
| Smith Jack Anthony | -- | -- | |
| Smith Jack Anthony | -- | Rattikin Title Co |
Source: Public Records
Mortgage History
| Date | Status | Borrower | Loan Amount |
|---|---|---|---|
| Open | Smotherman John S | $153,772 | |
| Previous Owner | Smith Jack Anthony | $104,500 | |
| Closed | Smith Jack Anthony | $0 |
Source: Public Records
Tax History Compared to Growth
Tax History
| Year | Tax Paid | Tax Assessment Tax Assessment Total Assessment is a certain percentage of the fair market value that is determined by local assessors to be the total taxable value of land and additions on the property. | Land | Improvement |
|---|---|---|---|---|
| 2025 | $5,441 | $330,000 | $75,000 | $255,000 |
| 2024 | $5,441 | $393,896 | $75,000 | $318,896 |
| 2023 | $4,923 | $370,053 | $45,000 | $325,053 |
| 2022 | $6,230 | $329,502 | $45,000 | $284,502 |
| 2021 | $6,108 | $259,309 | $45,000 | $214,309 |
| 2020 | $6,291 | $264,602 | $45,000 | $219,602 |
| 2019 | $5,906 | $272,833 | $45,000 | $227,833 |
| 2018 | $4,987 | $221,008 | $45,000 | $176,008 |
| 2017 | $4,860 | $200,916 | $35,000 | $165,916 |
| 2016 | $4,511 | $188,932 | $35,000 | $153,932 |
| 2015 | $3,595 | $171,952 | $35,000 | $136,952 |
| 2014 | $3,595 | $154,100 | $25,000 | $129,100 |
Source: Public Records
Map
Nearby Homes
- 1704 Indian Oaks Ct
- 1636 Bedford Oaks Dr
- 1723 Post Oak Dr
- 1630 Post Oak Dr
- 2901 Miles Way
- 37 Devonshire Dr
- 1401 Danielle Dr
- 1800 Hampton Dr
- 22 Lincolnshire Cir
- 3532 Meadowside Dr
- 3513 Meadowside Dr
- 3301 Wendover Ct
- 1209 Hillandale Ct
- 1820 Wimbleton Dr
- 1601 Warwickshire Ct W
- 2112 Oakmeadow Place
- 2524 Shady Ridge Dr
- 2503 Shady Ridge Dr
- 2109 Oakmeadow St
- 2704 Shady Grove Dr
- 1704 Bedford Oaks Ct
- 1707 Indian Oaks Ct
- 1707 Bedford Oaks Ct
- 1703 Indian Oaks Ct
- 1711 Indian Oaks Ct
- 1700 Bedford Oaks Ct
- 3028 Bramble Oaks Ct
- 1701 Indian Oaks Ct
- 3027 Bramble Oaks Ct
- 1701 Bedford Oaks Dr
- 3024 Bramble Oaks Ct
- 2928 Tangle Oaks Ct
- 3023 Oak Valley Dr
- 1712 Indian Oaks Ct
- 3019 Oak Valley Dr
- 1708 Indian Oaks Ct
- 1709 Bedford Oaks Dr
- 1713 Bedford Oaks Dr
- 1705 Bedford Oaks Dr
- 3027 Oak Valley Dr