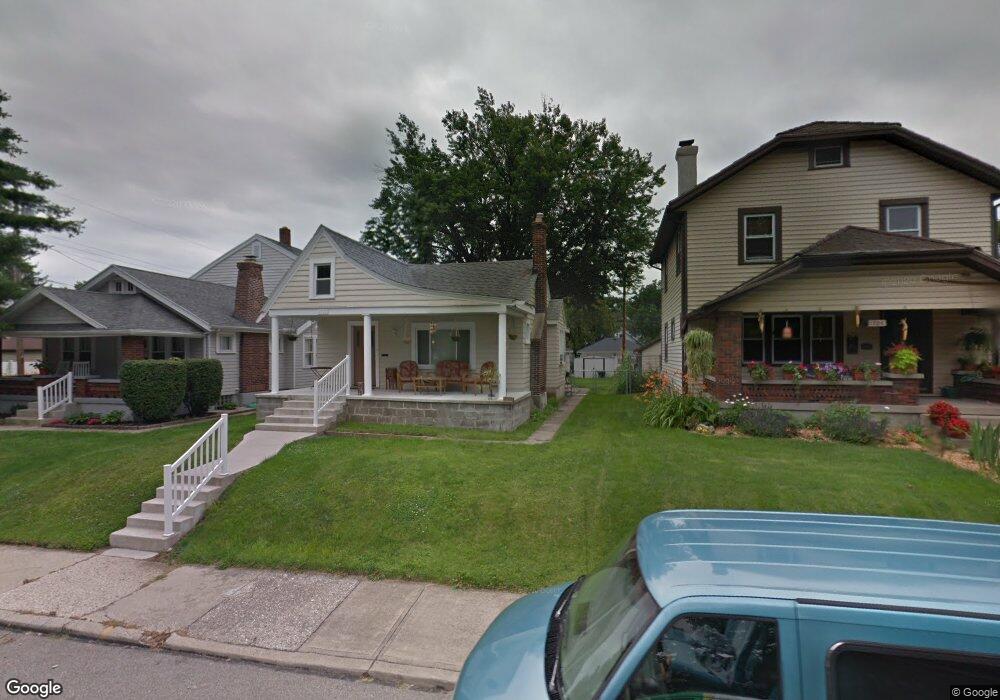
1708 Clarence St Dayton, OH 45410
Belmont NeighborhoodEstimated Value: $125,119 - $161,000
2
Beds
1
Bath
1,052
Sq Ft
$131/Sq Ft
Est. Value
About This Home
This home is located at 1708 Clarence St, Dayton, OH 45410 and is currently estimated at $137,780, approximately $130 per square foot. 1708 Clarence St is a home located in Montgomery County with nearby schools including Cleveland Elementary School, Horace Mann Elementary School, and Eastmont Elementary.
Ownership History
Date
Name
Owned For
Owner Type
Purchase Details
Closed on
Jun 5, 2020
Sold by
Lane Denise Sue and The Denise Sue Lane Trust
Bought by
Murdock Samantha L
Current Estimated Value
Home Financials for this Owner
Home Financials are based on the most recent Mortgage that was taken out on this home.
Original Mortgage
$96,903
Outstanding Balance
$85,897
Interest Rate
3.2%
Mortgage Type
New Conventional
Estimated Equity
$51,883
Purchase Details
Closed on
Mar 13, 2019
Sold by
Lane Denise Sue and Lane Denise S
Bought by
Lane Denise Sue and Denise Sue Lane Trust
Purchase Details
Closed on
Sep 16, 2004
Sold by
Johnson Steve C and Johnson Patricia L
Bought by
Lane Denise S
Home Financials for this Owner
Home Financials are based on the most recent Mortgage that was taken out on this home.
Original Mortgage
$48,600
Interest Rate
6.08%
Mortgage Type
Fannie Mae Freddie Mac
Create a Home Valuation Report for This Property
The Home Valuation Report is an in-depth analysis detailing your home's value as well as a comparison with similar homes in the area
Home Values in the Area
Average Home Value in this Area
Purchase History
| Date | Buyer | Sale Price | Title Company |
|---|---|---|---|
| Murdock Samantha L | $99,900 | Fidelity Lawyers Ttl Agcy Ll | |
| Lane Denise Sue | -- | None Available | |
| Lane Denise S | $54,000 | None Available |
Source: Public Records
Mortgage History
| Date | Status | Borrower | Loan Amount |
|---|---|---|---|
| Open | Murdock Samantha L | $96,903 | |
| Previous Owner | Lane Denise S | $48,600 |
Source: Public Records
Tax History Compared to Growth
Tax History
| Year | Tax Paid | Tax Assessment Tax Assessment Total Assessment is a certain percentage of the fair market value that is determined by local assessors to be the total taxable value of land and additions on the property. | Land | Improvement |
|---|---|---|---|---|
| 2024 | $1,513 | $26,850 | $6,670 | $20,180 |
| 2023 | $1,513 | $26,850 | $6,670 | $20,180 |
| 2022 | $1,592 | $21,870 | $5,430 | $16,440 |
| 2021 | $1,626 | $21,870 | $5,430 | $16,440 |
| 2020 | $1,579 | $21,870 | $5,430 | $16,440 |
| 2019 | $1,592 | $19,340 | $6,030 | $13,310 |
| 2018 | $1,595 | $19,340 | $6,030 | $13,310 |
| 2017 | $1,583 | $19,340 | $6,030 | $13,310 |
| 2016 | $1,653 | $19,230 | $6,030 | $13,200 |
| 2015 | $1,564 | $19,230 | $6,030 | $13,200 |
| 2014 | $1,564 | $19,230 | $6,030 | $13,200 |
| 2012 | -- | $18,730 | $6,030 | $12,700 |
Source: Public Records
Map
Nearby Homes
- 1355 Epworth Ave Unit 1353
- 2600 Wayne Ave
- 1414 Phillips Ave
- 1257 Epworth Ave
- 1255 Phillips Ave
- 1254 Phillips Ave
- 1235 Holly Ave
- 1159 Highland Ave
- 1254 Creighton Ave
- 1300 Carlisle Ave
- 222 Illinois Ave
- 144 Illinois Ave
- 1311 Pursell Ave
- 2010 Argyle Ave
- 2107 Wayne Ave
- 56 Watervliet Ave
- 1230 Pursell Ave
- 1205 Pursell Ave
- 3136 Hassler St
- 332 Gunckel Ave
- 1712 Clarence St
- 1704 Clarence St
- 1700 Clarence St
- 1636 Clarence St
- 1407 Epworth Ave
- 1411 Epworth Ave
- 1403 Epworth Ave
- 1415 Epworth Ave
- 1632 Clarence St
- 2444 Wayne Ave
- 2440 Wayne Ave
- 2448 Wayne Ave
- 1365 Epworth Ave
- 2432 Wayne Ave
- 2432 Wayne Ave Unit 2434
- 2454 Wayne Ave
- 2434 Wayne Ave
- 2456 Wayne Ave
- 1361 Epworth Ave
- 2428 Wayne Ave