1708 Moonglow Rd Centralia, IL 62801
Estimated Value: $155,921 - $246,000
2
Beds
2
Baths
1,450
Sq Ft
$133/Sq Ft
Est. Value
About This Home
This home is located at 1708 Moonglow Rd, Centralia, IL 62801 and is currently estimated at $192,730, approximately $132 per square foot. 1708 Moonglow Rd is a home located in Marion County with nearby schools including Centralia High School, St. Mary School, and Trinity Lutheran School.
Ownership History
Date
Name
Owned For
Owner Type
Purchase Details
Closed on
Feb 25, 2019
Sold by
Gustafson Vincent H and Gustafson Jeanne Anne
Bought by
Taylor Sarah Lynn
Current Estimated Value
Purchase Details
Closed on
Jun 26, 2009
Sold by
Shahmohammadi Kianor and Shahmohammadi Mallori
Bought by
Gustafson Vincent H and Gustafson Jeanne Ann
Home Financials for this Owner
Home Financials are based on the most recent Mortgage that was taken out on this home.
Original Mortgage
$92,000
Interest Rate
4.94%
Mortgage Type
New Conventional
Purchase Details
Closed on
Apr 26, 2007
Sold by
Spitler Robert L and Spitler Beverly Joane
Bought by
Shahmohammadi Kianor
Home Financials for this Owner
Home Financials are based on the most recent Mortgage that was taken out on this home.
Original Mortgage
$83,200
Interest Rate
4.6%
Mortgage Type
Purchase Money Mortgage
Create a Home Valuation Report for This Property
The Home Valuation Report is an in-depth analysis detailing your home's value as well as a comparison with similar homes in the area
Purchase History
| Date | Buyer | Sale Price | Title Company |
|---|---|---|---|
| Taylor Sarah Lynn | -- | None Available | |
| Gustafson Vincent H | $57,500 | None Available | |
| Shahmohammadi Kianor | $52,000 | Quad County Title Co Inc |
Source: Public Records
Mortgage History
| Date | Status | Borrower | Loan Amount |
|---|---|---|---|
| Previous Owner | Gustafson Vincent H | $92,000 | |
| Previous Owner | Shahmohammadi Kianor | $83,200 |
Source: Public Records
Tax History Compared to Growth
Tax History
| Year | Tax Paid | Tax Assessment Tax Assessment Total Assessment is a certain percentage of the fair market value that is determined by local assessors to be the total taxable value of land and additions on the property. | Land | Improvement |
|---|---|---|---|---|
| 2024 | $3,003 | $44,570 | $5,030 | $39,540 |
| 2023 | $3,065 | $41,650 | $4,700 | $36,950 |
| 2022 | $2,950 | $37,860 | $4,270 | $33,590 |
| 2021 | $2,889 | $35,380 | $3,990 | $31,390 |
| 2020 | $2,834 | $34,330 | $3,870 | $30,460 |
| 2019 | $2,755 | $33,070 | $3,730 | $29,340 |
| 2018 | $2,802 | $33,070 | $3,730 | $29,340 |
| 2017 | $2,781 | $32,420 | $3,660 | $28,760 |
| 2016 | $2,760 | $31,170 | $3,520 | $27,650 |
| 2015 | $27 | $31,170 | $3,520 | $27,650 |
| 2012 | $26 | $30,570 | $3,460 | $27,110 |
Source: Public Records
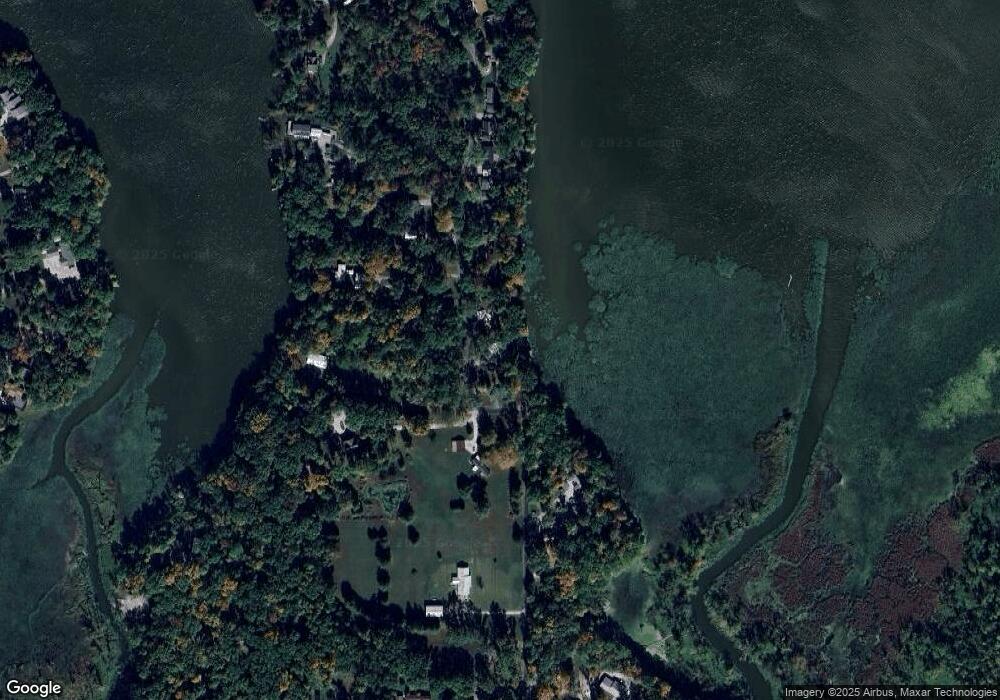
Map
Nearby Homes
- 1629 Firewood Ln
- 1966 Ross Rd
- 1670 Woods Ln
- 17 Crestwood Dr
- 101 Marilyn Ave
- 12 Clearlake Dr
- 22 Clearlake Dr
- 503 Airport Rd
- 20 Bel Air Dr
- 57 Sherwood Dr
- 11 Ridge Rd
- 1 Estate Dr
- 8 Ronnies Terrace
- 1782 Frazier Ave
- 540 Meadowbrook Ln
- 1201 E Noleman St
- 628 Sara Dr
- 634 Sara Dr
- 962 E Broadway
- 122 E Calumet St
- 1702 Moonglow Rd
- 1714 Moonglow Rd
- 1726 Moonglow Rd
- 1661 Moonglow Rd
- 1662 Moonglow Rd
- 1732 Moonglow Rd
- 1732 Moonglow Rd
- 1663 Moonglow Rd
- 1733 Moonglow Rd
- 1660 Moonglow Rd
- 1660 Moonglow Rd
- 1658 Moonglow Rd
- 1721 Moonglow Rd
- 1738 Moonglow Rd
- 1654 Moonglow Rd
- 1637 Moonglow Rd
- 1737 Moonglow Rd
- 1744 Moonglow Rd
- 1648 Moonglow Rd
- 1750 Moonglow Rd