Estimated Value: $169,718 - $188,000
3
Beds
2
Baths
1,239
Sq Ft
$144/Sq Ft
Est. Value
About This Home
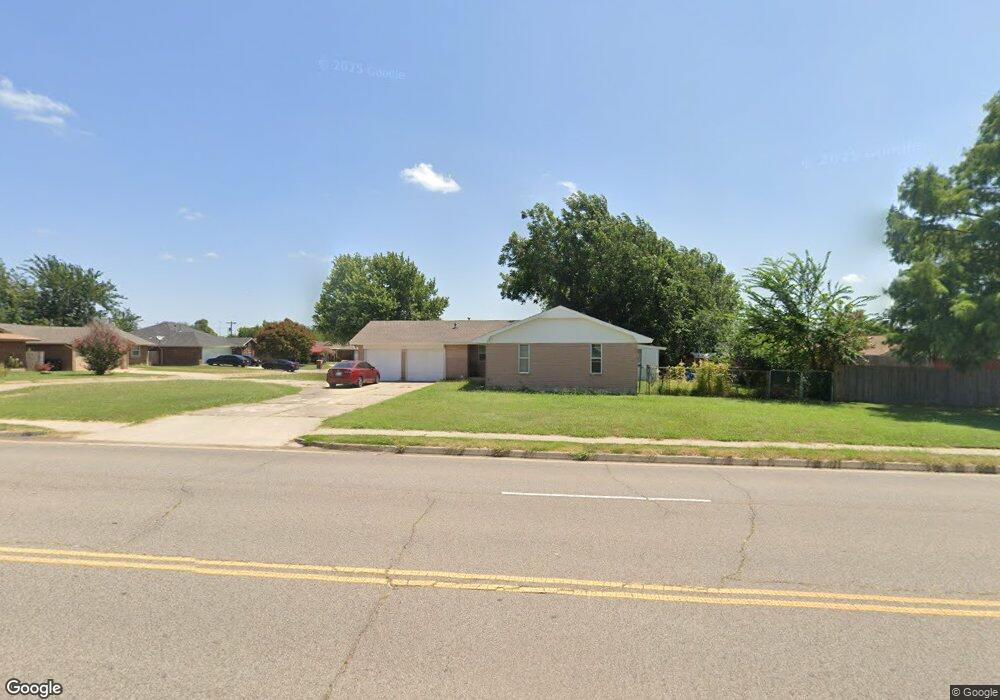
This home is located at 1708 N Janeway Ave, Moore, OK 73160 and is currently estimated at $178,180, approximately $143 per square foot. 1708 N Janeway Ave is a home located in Cleveland County with nearby schools including Kelley Elementary School, Highland West Junior High School, and Southmoore High School.
Ownership History
Date
Name
Owned For
Owner Type
Purchase Details
Closed on
Oct 16, 2006
Sold by
Lam Nghia
Bought by
Lam Neghai and Lam Thuy Hong
Current Estimated Value
Home Financials for this Owner
Home Financials are based on the most recent Mortgage that was taken out on this home.
Original Mortgage
$52,880
Interest Rate
6.79%
Mortgage Type
New Conventional
Purchase Details
Closed on
Aug 29, 2006
Sold by
Jackson Alphonso
Bought by
Lam Nghia
Home Financials for this Owner
Home Financials are based on the most recent Mortgage that was taken out on this home.
Original Mortgage
$52,880
Interest Rate
6.79%
Mortgage Type
New Conventional
Purchase Details
Closed on
Jun 2, 2005
Sold by
Morrow Lonnie and Morrow Jaretta
Bought by
Secretary Of Hud
Purchase Details
Closed on
Aug 26, 2002
Sold by
Pigg Danny R and Pigg Shirley D
Bought by
Morrow Lonnie
Create a Home Valuation Report for This Property
The Home Valuation Report is an in-depth analysis detailing your home's value as well as a comparison with similar homes in the area
Home Values in the Area
Average Home Value in this Area
Purchase History
| Date | Buyer | Sale Price | Title Company |
|---|---|---|---|
| Lam Neghai | -- | None Available | |
| Lam Nghia | -- | None Available | |
| Secretary Of Hud | $72,957 | None Available | |
| Morrow Lonnie | $74,500 | -- |
Source: Public Records
Mortgage History
| Date | Status | Borrower | Loan Amount |
|---|---|---|---|
| Previous Owner | Lam Nghia | $52,880 |
Source: Public Records
Tax History
| Year | Tax Paid | Tax Assessment Tax Assessment Total Assessment is a certain percentage of the fair market value that is determined by local assessors to be the total taxable value of land and additions on the property. | Land | Improvement |
|---|---|---|---|---|
| 2025 | $1,737 | $14,186 | $2,248 | $11,938 |
| 2023 | $1,569 | $12,868 | $2,204 | $10,664 |
| 2022 | $1,517 | $12,255 | $2,765 | $9,490 |
| 2021 | $1,450 | $11,671 | $2,949 | $8,722 |
| 2020 | $1,382 | $11,116 | $1,920 | $9,196 |
| 2019 | $1,407 | $11,116 | $1,920 | $9,196 |
| 2018 | $1,407 | $11,116 | $1,920 | $9,196 |
| 2017 | $1,414 | $11,116 | $0 | $0 |
| 2016 | $1,425 | $11,116 | $1,920 | $9,196 |
| 2015 | -- | $11,092 | $1,916 | $9,176 |
| 2014 | -- | $10,563 | $1,080 | $9,483 |
Source: Public Records
Map
Nearby Homes
- 804 NW 16th St
- 1528 Tudor Dr
- 873 N Windermere Dr
- 644 NW 20th St
- 665 NW 15th St
- 1421 N Norman Ave
- 704 NW 21st St
- 1317 Lawton
- 2000 Sunrise
- 1121 Cavalier St
- 1039 NW 18th St
- 2404 Piccadilly Cir
- 1001 N Norman Ave
- 841 NW 8th St
- 1905 Julie Dr
- 1612 Dorothy Dr
- 817 NW 7th St
- 2413 Queensbury Rd
- 2508 Yorkshire Ave
- 1029 NW 10th St
Your Personal Tour Guide
Ask me questions while you tour the home.