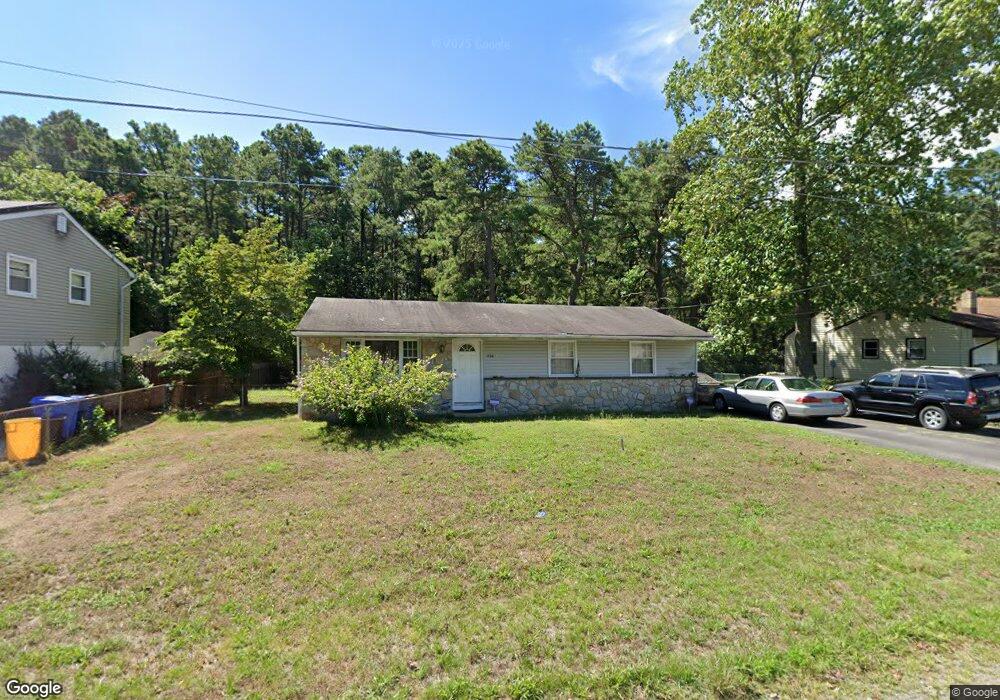
1708 Red Feather Trail Browns Mills, NJ 08015
Estimated Value: $303,000 - $322,000
--
Bed
--
Bath
1,092
Sq Ft
$286/Sq Ft
Est. Value
About This Home
This home is located at 1708 Red Feather Trail, Browns Mills, NJ 08015 and is currently estimated at $311,873, approximately $285 per square foot. 1708 Red Feather Trail is a home located in Burlington County.
Ownership History
Date
Name
Owned For
Owner Type
Purchase Details
Closed on
Mar 11, 2004
Sold by
Engel Desiree D
Bought by
Gonzalez Jose L
Current Estimated Value
Home Financials for this Owner
Home Financials are based on the most recent Mortgage that was taken out on this home.
Original Mortgage
$114,750
Outstanding Balance
$53,554
Interest Rate
5.65%
Mortgage Type
Purchase Money Mortgage
Estimated Equity
$258,319
Purchase Details
Closed on
Sep 22, 2000
Sold by
Kemp John M and Kemp Corinne
Bought by
Gonzalez Jose L and Engei Desiree D
Home Financials for this Owner
Home Financials are based on the most recent Mortgage that was taken out on this home.
Original Mortgage
$90,849
Interest Rate
7.96%
Mortgage Type
FHA
Purchase Details
Closed on
Aug 11, 1999
Sold by
Bankers Trust Company Of California
Bought by
Kemp John Michael and Kemp Corinne
Home Financials for this Owner
Home Financials are based on the most recent Mortgage that was taken out on this home.
Original Mortgage
$54,000
Interest Rate
8.21%
Purchase Details
Closed on
Jun 5, 1995
Sold by
Cummings Edward A
Bought by
Va
Create a Home Valuation Report for This Property
The Home Valuation Report is an in-depth analysis detailing your home's value as well as a comparison with similar homes in the area
Home Values in the Area
Average Home Value in this Area
Purchase History
| Date | Buyer | Sale Price | Title Company |
|---|---|---|---|
| Gonzalez Jose L | -- | -- | |
| Gonzalez Jose L | $90,900 | Security First Title Partner | |
| Kemp John Michael | $60,000 | Security First Title Partner | |
| Va | -- | -- |
Source: Public Records
Mortgage History
| Date | Status | Borrower | Loan Amount |
|---|---|---|---|
| Open | Gonzalez Jose L | $114,750 | |
| Previous Owner | Gonzalez Jose L | $90,849 | |
| Previous Owner | Kemp John Michael | $54,000 |
Source: Public Records
Tax History Compared to Growth
Tax History
| Year | Tax Paid | Tax Assessment Tax Assessment Total Assessment is a certain percentage of the fair market value that is determined by local assessors to be the total taxable value of land and additions on the property. | Land | Improvement |
|---|---|---|---|---|
| 2025 | $4,181 | $136,400 | $37,800 | $98,600 |
| 2024 | $3,923 | $136,400 | $37,800 | $98,600 |
| 2023 | $3,923 | $136,400 | $37,800 | $98,600 |
| 2022 | $3,631 | $136,400 | $37,800 | $98,600 |
| 2021 | $3,482 | $136,400 | $37,800 | $98,600 |
| 2020 | $3,351 | $136,400 | $37,800 | $98,600 |
| 2019 | $3,209 | $136,400 | $37,800 | $98,600 |
| 2018 | $3,100 | $136,400 | $37,800 | $98,600 |
| 2017 | $3,036 | $136,400 | $37,800 | $98,600 |
| 2016 | $3,035 | $81,200 | $22,300 | $58,900 |
| 2015 | $3,011 | $81,200 | $22,300 | $58,900 |
| 2014 | $2,879 | $81,200 | $22,300 | $58,900 |
Source: Public Records
Map
Nearby Homes
- 1714 Red Feather Trail
- 203 Seneca Trail
- 224 Cherokee Dr
- 304 Mohawk Trail
- 406 Cherokee Dr
- 6 Spring Terrace
- 317 Cayuga Trail
- 14 Akwaala Trail
- 306 Apache Trail
- 13 Muskogean Trail
- 9 Winnebago Trail
- 315 Algonquin Trail
- 22 Maricopa Trail
- 77 Sepulga Dr
- 208 Wichita Trail
- 2 Kiowa Trail
- 206 Piute Trail
- 310 Piute Trail
- 764 Lakehurst Rd
- 111 Huckleberry Ln
- 1710 Red Feather Trail
- 1704 Red Feather Trail
- 1703 Red Feather Trail
- 209 Robin Rd
- 208 Oriole Rd
- 210 Robin Rd
- 1701 Red Feather Trail
- 207 Robin Rd
- 208 Robin Rd
- 206 Robin Rd
- 301 Seneca Trail
- 211 Seneca Trail
- 205 Robin Rd
- 1716 Red Feather Trail
- 209 Seneca Trail
- 205 Oriole Rd
- 204 Robin Rd
- 207 Seneca Trail
- 1720 Red Feather Trail
- 208 Seneca Trail