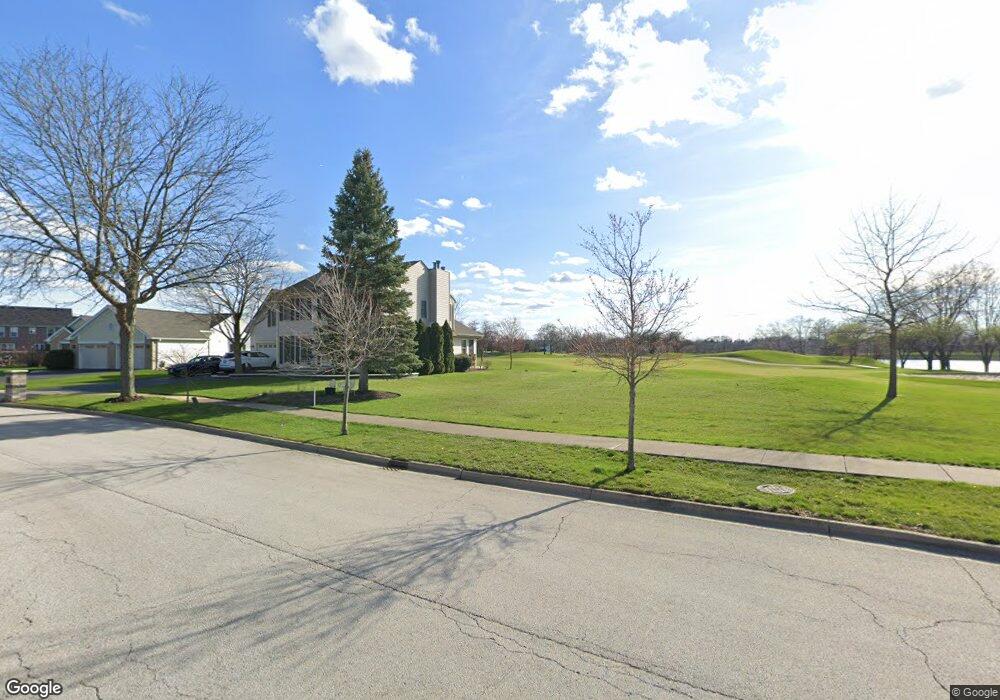
1708 Roanoke Ave Aurora, IL 60506
Edgelawn Randall NeighborhoodEstimated Value: $275,000 - $301,000
3
Beds
2
Baths
960
Sq Ft
$299/Sq Ft
Est. Value
About This Home
This home is located at 1708 Roanoke Ave, Aurora, IL 60506 and is currently estimated at $287,294, approximately $299 per square foot. 1708 Roanoke Ave is a home located in Kane County with nearby schools including Hall Elementary School, Jefferson Middle School, and West Aurora High School.
Ownership History
Date
Name
Owned For
Owner Type
Purchase Details
Closed on
Nov 30, 2021
Sold by
Jacob Mack
Bought by
Lopez Olivia and Arevalo Gabriel
Current Estimated Value
Home Financials for this Owner
Home Financials are based on the most recent Mortgage that was taken out on this home.
Original Mortgage
$219,942
Interest Rate
3.13%
Mortgage Type
FHA
Purchase Details
Closed on
Jul 6, 2017
Sold by
Buzen Bradley J and Buzen Jeanenne D
Bought by
Mack Jacob and Mack Charles E
Home Financials for this Owner
Home Financials are based on the most recent Mortgage that was taken out on this home.
Original Mortgage
$126,750
Interest Rate
4.37%
Mortgage Type
New Conventional
Create a Home Valuation Report for This Property
The Home Valuation Report is an in-depth analysis detailing your home's value as well as a comparison with similar homes in the area
Home Values in the Area
Average Home Value in this Area
Purchase History
| Date | Buyer | Sale Price | Title Company |
|---|---|---|---|
| Lopez Olivia | $224,000 | First American Title | |
| Mack Jacob | $169,000 | Security First Title Co |
Source: Public Records
Mortgage History
| Date | Status | Borrower | Loan Amount |
|---|---|---|---|
| Previous Owner | Lopez Olivia | $219,942 | |
| Previous Owner | Mack Jacob | $126,750 |
Source: Public Records
Tax History Compared to Growth
Tax History
| Year | Tax Paid | Tax Assessment Tax Assessment Total Assessment is a certain percentage of the fair market value that is determined by local assessors to be the total taxable value of land and additions on the property. | Land | Improvement |
|---|---|---|---|---|
| 2024 | $4,835 | $69,060 | $13,876 | $55,184 |
| 2023 | $4,600 | $61,705 | $12,398 | $49,307 |
| 2022 | $4,453 | $56,300 | $11,312 | $44,988 |
| 2021 | $4,241 | $52,416 | $10,532 | $41,884 |
| 2020 | $4,522 | $54,304 | $9,783 | $44,521 |
| 2019 | $4,333 | $50,314 | $9,064 | $41,250 |
| 2018 | $3,967 | $45,735 | $8,384 | $37,351 |
| 2017 | $3,444 | $46,461 | $7,725 | $38,736 |
| 2016 | $2,885 | $40,154 | $6,622 | $33,532 |
| 2015 | -- | $35,167 | $5,694 | $29,473 |
| 2014 | -- | $32,665 | $5,233 | $27,432 |
| 2013 | -- | $33,101 | $5,158 | $27,943 |
Source: Public Records
Map
Nearby Homes
- 1747 W Illinois Ave
- 630 N Buell Ave
- 1751 Greene Ct
- 1735 Greene Ct
- 113 Stonewood Place Unit 6D
- 115 Hillwood Place Unit 4B
- 972 Westgate Dr
- 833 N Randall Rd Unit C4
- 1389 Monomoy St Unit B2
- 1730 W Galena Blvd Unit 402E
- 1035 Newcastle Ln
- 1390 N Glen Cir Unit B
- 1351 Monomoy St Unit D
- 1543 W Downer Place
- 2220 Mayflower Dr
- 960 Sapphire Ln
- 964 Sapphire Ln
- 1120 Emerald Dr
- 1149 Newcastle Ln
- 967 Sapphire Ln
- 1708 Roanoak Ave
- 1712 Roanoke Ave
- 1702 Roanoke Ave
- 1721 W Illinois Ave
- 1658 Roanoke Ave
- 1720 Roanoke Ave
- 1715 W Illinois Ave
- 1727 W Illinois Ave
- 1711 Roanoke Ave
- 1709 W Illinois Ave
- 1733 W Illinois Ave
- 1703 Roanoke Ave
- 1652 Roanoke Ave
- 1726 Roanoke Ave
- 1715 Roanoke Ave
- 1739 W Illinois Ave
- 1646 Roanoke Ave
- 1732 Roanoke Ave
- 739 Sherwood Ave