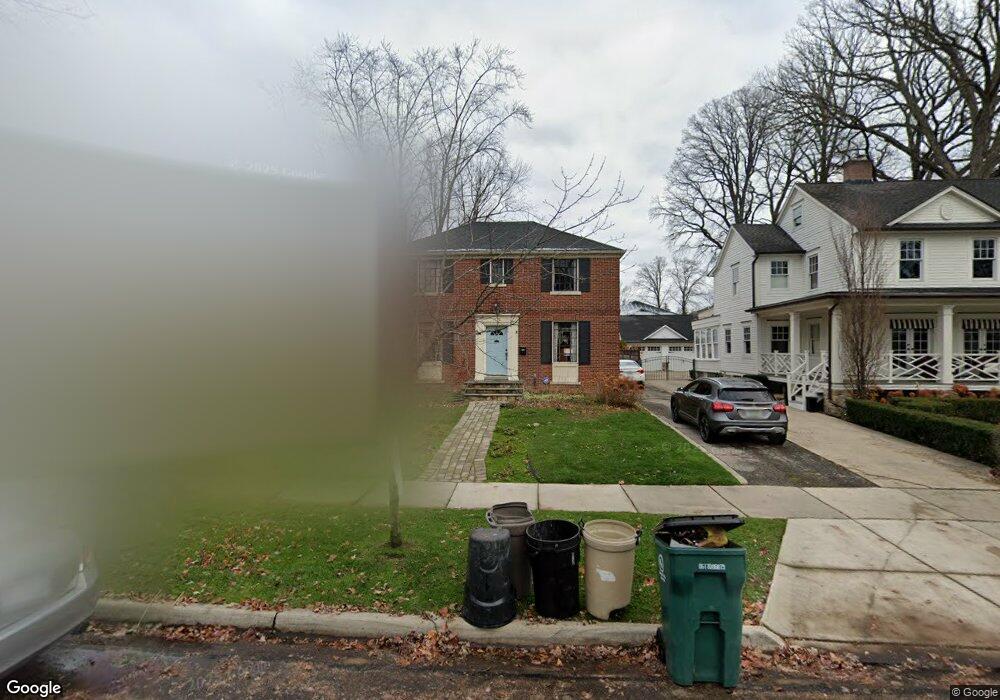
1708 Roseland Ave Royal Oak, MI 48073
Estimated Value: $422,363 - $580,000
2
Beds
2
Baths
1,533
Sq Ft
$318/Sq Ft
Est. Value
About This Home
This home is located at 1708 Roseland Ave, Royal Oak, MI 48073 and is currently estimated at $486,841, approximately $317 per square foot. 1708 Roseland Ave is a home located in Oakland County with nearby schools including Northwood Elementary School, Royal Oak Middle School, and Royal Oak High School.
Ownership History
Date
Name
Owned For
Owner Type
Purchase Details
Closed on
Nov 22, 2024
Sold by
Monicatti Amy E
Bought by
Monicatti Amy E and Foster Zachary Paxton
Current Estimated Value
Purchase Details
Closed on
Jun 16, 2017
Sold by
Leyva Francisco J and Monicatti Leyva Amy E
Bought by
Monicatti Amy E
Home Financials for this Owner
Home Financials are based on the most recent Mortgage that was taken out on this home.
Original Mortgage
$221,000
Interest Rate
4.05%
Mortgage Type
New Conventional
Purchase Details
Closed on
Nov 19, 2004
Sold by
Santoni Alan J and Santoni Nancy L
Bought by
Leyva Francisco J and Monicatti Leyva Amy E
Create a Home Valuation Report for This Property
The Home Valuation Report is an in-depth analysis detailing your home's value as well as a comparison with similar homes in the area
Home Values in the Area
Average Home Value in this Area
Purchase History
| Date | Buyer | Sale Price | Title Company |
|---|---|---|---|
| Monicatti Amy E | -- | None Listed On Document | |
| Monicatti Amy E | -- | None Available | |
| Leyva Francisco J | $335,000 | Metropolitan Title Company |
Source: Public Records
Mortgage History
| Date | Status | Borrower | Loan Amount |
|---|---|---|---|
| Previous Owner | Monicatti Amy E | $221,000 |
Source: Public Records
Tax History Compared to Growth
Tax History
| Year | Tax Paid | Tax Assessment Tax Assessment Total Assessment is a certain percentage of the fair market value that is determined by local assessors to be the total taxable value of land and additions on the property. | Land | Improvement |
|---|---|---|---|---|
| 2024 | $3,891 | $167,280 | $0 | $0 |
| 2022 | $4,597 | $149,830 | $0 | $0 |
| 2020 | $3,781 | $136,590 | $0 | $0 |
| 2018 | $4,597 | $129,740 | $0 | $0 |
| 2017 | $4,419 | $129,740 | $0 | $0 |
| 2015 | -- | $122,070 | $0 | $0 |
| 2014 | -- | $113,240 | $0 | $0 |
| 2011 | -- | $103,350 | $0 | $0 |
Source: Public Records
Map
Nearby Homes
- 1631 Roseland Ave
- 1718 W 12 Mile Rd
- 1630 W 12 Mile Rd
- 1808 W 12 Mile Rd
- 1828 W 12 Mile Rd
- 1507 Roseland Ave
- 1915 Northwood Blvd
- 2015 Alicia Ln
- 1721 Forestdale Ct
- 2422 Oliver Rd
- 1319 Woodsboro Dr
- 1211 Smith Ave
- 2438 Evergreen Dr
- 1363 Edgewood Blvd
- 2125 Clawson Ave Unit 107
- 2125 Clawson Ave Unit 207
- 1450 Wiltshire Rd
- 1103 Fernwood Rd
- 2403 Clawson Ave
- 1022 Maplegrove Ave
- 1712 Roseland Ave
- 1702 Roseland Ave
- 1718 Roseland Ave
- 1630 Roseland Ave
- 1709 W Houstonia Ave
- 1715 W Houstonia Ave
- 1703 W Houstonia Ave
- ECORSE W Houstonia Ave W
- 1722 Roseland Ave
- 1719 W Houstonia Ave
- 1626 Roseland Ave
- 1631 W Houstonia Ave
- 1728 Roseland Ave
- 1723 W Houstonia Ave
- 1713 Roseland Ave
- 1709 Roseland Ave
- 1703 Roseland Ave
- 1719 Roseland Ave
- 1802 Roseland Ave
- 1627 W Houstonia Ave