
Seller's Agent in 2015
Erin Woste
eRealty KC, LLC
(816) 674-6760
51 Total Sales
Estimated Value: $286,399 - $312,000
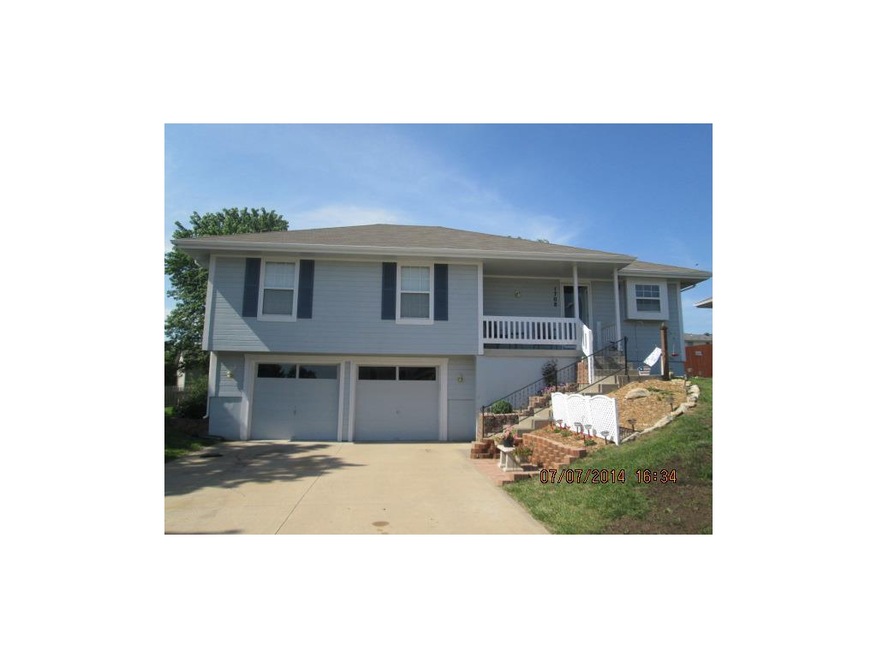
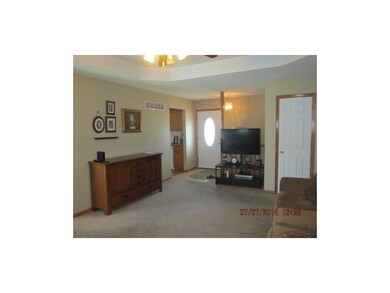
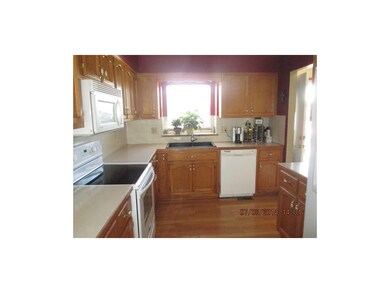
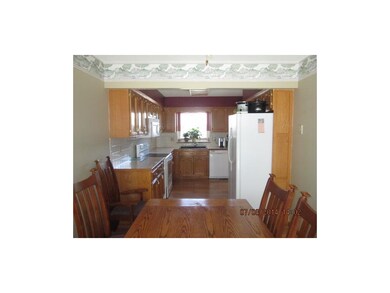
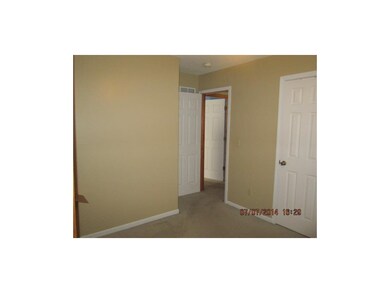
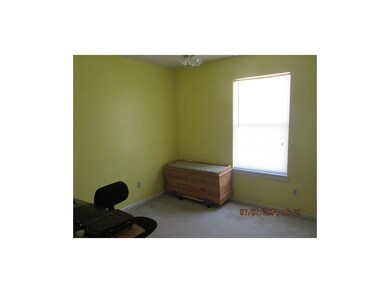
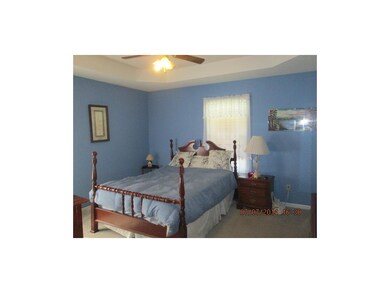
Immaculately maintained home in Raymore you won't want to miss! So many updated items including interior/exterior paint, 6 panel doors, appliances and much more! Large back yard with deck overlooking serene atmosphere of beautiful landscaping. Fully finished basement with possible bedroom, office or rec room, and full bathroom with jacuzzi tub. Ideal location close to major roads and easy access to highway. The home is move-in ready and is an ideal family home. Original owners have lovingly cared for the home.
Last Agent to Sell the Property
eRealty KC, LLC License #1999115364 Listed on: 07/07/2014
Last Buyer's Agent
Spencer Lindahl
License #BR00234854
We collect this data history from publicly available records. To have your information removed, we recommend requesting removal directly through your county’s website.
We collect this data history from publicly available records. To have your information removed, we recommend requesting removal directly through your county’s website.
| Date | Buyer | Sale Price | Title Company |
|---|---|---|---|
| -- | None Available | ||
| -- | None Available |
We collect this data history from publicly available records. To have your information removed, we recommend requesting removal directly through your county’s website.
| Date | Event | Price | List to Sale | Price per Sq Ft |
|---|---|---|---|---|
| 01/26/2015 01/26/15 | Sold | -- | -- | -- |
| 12/08/2014 12/08/14 | Pending | -- | -- | -- |
| 07/08/2014 07/08/14 | For Sale | $145,000 | -- | $121 / Sq Ft |
We collect this data history from publicly available records. To have your information removed, we recommend requesting removal directly through your county’s website.
| Year | Tax Paid | Tax Assessment Tax Assessment Total Assessment is a certain percentage of the fair market value that is determined by local assessors to be the total taxable value of land and additions on the property. | Land | Improvement |
|---|---|---|---|---|
| 2025 | $2,434 | $33,460 | $5,050 | $28,410 |
| 2024 | $2,434 | $29,910 | $4,590 | $25,320 |
| 2023 | $2,431 | $29,910 | $4,590 | $25,320 |
| 2022 | $2,157 | $26,360 | $4,590 | $21,770 |
| 2021 | $2,157 | $26,360 | $4,590 | $21,770 |
| 2020 | $2,118 | $25,430 | $4,590 | $20,840 |
| 2019 | $2,045 | $25,430 | $4,590 | $20,840 |
| 2018 | $1,892 | $22,720 | $3,860 | $18,860 |
| 2017 | $1,732 | $22,720 | $3,860 | $18,860 |
| 2016 | $1,732 | $21,590 | $3,860 | $17,730 |
| 2015 | $1,733 | $21,590 | $3,860 | $17,730 |
| 2014 | $1,649 | $20,530 | $3,860 | $16,670 |
| 2013 | -- | $20,530 | $3,860 | $16,670 |
Seller's Agent in 2015
Erin Woste
eRealty KC, LLC
(816) 674-6760
51 Total Sales
S
Buyer's Agent in 2015
Spencer Lindahl
Source: Heartland MLS
MLS Number: 1893118
APN: 2323280
Disclaimer: Certain information contained herein is derived from information provided by parties other than Homes.com. All information provided is deemed reliable, but is not guaranteed to be accurate and should be independently verified.
![]() All data is obtained from various sources and may not have been verified by broker or MLS GRID. Supplied Open House Information is subject to change without notice. All information should be independently reviewed and verified for accuracy. Properties may or may not be listed by the office/agent presenting the information. Some IDX listings have been excluded from this website. Prices displayed on all Sold listings are the Last Known Listing Price and may not be the actual selling price.
All data is obtained from various sources and may not have been verified by broker or MLS GRID. Supplied Open House Information is subject to change without notice. All information should be independently reviewed and verified for accuracy. Properties may or may not be listed by the office/agent presenting the information. Some IDX listings have been excluded from this website. Prices displayed on all Sold listings are the Last Known Listing Price and may not be the actual selling price.
Listings courtesy of Heartland MLS as distributed by MLS GRID.
Based on information submitted to the MLS GRID
Listing Information presented by local MLS brokerage: TEN-X, INC., local REALTOR®- Arlene Richardson - (888) 952-6393
Ask me questions while you tour the home.