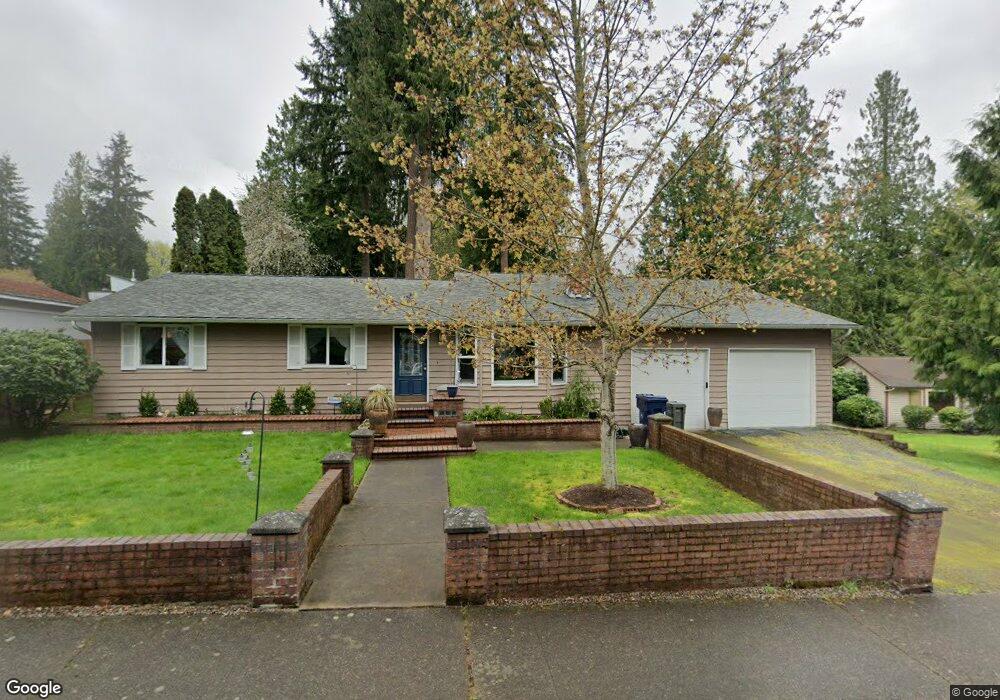
1709 170th Place SE Bothell, WA 98012
North Creek NeighborhoodEstimated Value: $729,000 - $890,000
3
Beds
2
Baths
1,792
Sq Ft
$458/Sq Ft
Est. Value
About This Home
This home is located at 1709 170th Place SE, Bothell, WA 98012 and is currently estimated at $820,475, approximately $457 per square foot. 1709 170th Place SE is a home located in Snohomish County with nearby schools including Woodside Elementary School, Heatherwood Middle School, and Henry M. Jackson High School.
Ownership History
Date
Name
Owned For
Owner Type
Purchase Details
Closed on
May 4, 2015
Sold by
Mccutcheon Joseph D and Donham Susan D
Bought by
Donham Susan D and Mccutcheon Joseph D
Current Estimated Value
Home Financials for this Owner
Home Financials are based on the most recent Mortgage that was taken out on this home.
Original Mortgage
$251,500
Outstanding Balance
$137,945
Interest Rate
3.64%
Mortgage Type
New Conventional
Estimated Equity
$682,530
Purchase Details
Closed on
Jun 1, 2005
Sold by
Kolander Mccutcheon Tiffany Ann
Bought by
Mccutcheon Joseph D
Home Financials for this Owner
Home Financials are based on the most recent Mortgage that was taken out on this home.
Original Mortgage
$230,000
Interest Rate
5.65%
Mortgage Type
Fannie Mae Freddie Mac
Purchase Details
Closed on
Oct 21, 1994
Sold by
Hardman Scott L and Hardman Dana M
Bought by
Mccutheon Joseph D and Kolander Mccutheon Tiffany Ann
Home Financials for this Owner
Home Financials are based on the most recent Mortgage that was taken out on this home.
Original Mortgage
$125,400
Interest Rate
8.7%
Create a Home Valuation Report for This Property
The Home Valuation Report is an in-depth analysis detailing your home's value as well as a comparison with similar homes in the area
Home Values in the Area
Average Home Value in this Area
Purchase History
| Date | Buyer | Sale Price | Title Company |
|---|---|---|---|
| Donham Susan D | -- | Chicago Title | |
| Mccutcheon Joseph D | -- | Chicago | |
| Mccutheon Joseph D | $132,000 | -- |
Source: Public Records
Mortgage History
| Date | Status | Borrower | Loan Amount |
|---|---|---|---|
| Open | Donham Susan D | $251,500 | |
| Closed | Mccutcheon Joseph D | $230,000 | |
| Closed | Mccutheon Joseph D | $125,400 |
Source: Public Records
Tax History
| Year | Tax Paid | Tax Assessment Tax Assessment Total Assessment is a certain percentage of the fair market value that is determined by local assessors to be the total taxable value of land and additions on the property. | Land | Improvement |
|---|---|---|---|---|
| 2026 | $7,368 | $804,100 | $550,000 | $254,100 |
| 2025 | $6,904 | $762,200 | $515,000 | $247,200 |
| 2024 | $6,904 | $717,200 | $470,000 | $247,200 |
| 2023 | $7,266 | $828,100 | $545,000 | $283,100 |
| 2022 | $6,139 | $605,000 | $365,000 | $240,000 |
| 2020 | $5,794 | $479,600 | $290,000 | $189,600 |
| 2019 | $5,495 | $456,300 | $270,000 | $186,300 |
| 2018 | $5,241 | $396,200 | $230,000 | $166,200 |
| 2017 | $4,551 | $345,900 | $190,000 | $155,900 |
| 2016 | $4,175 | $333,400 | $167,000 | $166,400 |
| 2015 | $4,161 | $315,100 | $164,000 | $151,100 |
| 2013 | $3,658 | $244,700 | $122,000 | $122,700 |
Source: Public Records
Map
Nearby Homes
- 16825 17th Ave SE
- 1815 172nd St SE
- 1516 170th Place SE
- 1621 Seattle Hill Rd Unit HH-2
- 1621 Seattle Hill Rd Unit Q3
- 1621 Seattle Hill Rd Unit JJ-3
- 1621 Seattle Hill Rd Unit K4
- 1621 Seattle Hill Rd Unit J5
- 1621 Seattle Hill Rd Unit C4
- 1621 Seattle Hill Rd Unit u-1
- 1325 Seattle Hill Rd Unit A2
- 1325 Seattle Hill Rd Unit A3
- 1325 Seattle Hill Rd Unit L2
- 17529 Brook Blvd
- 2502 166th Place SE
- 16225 15th Dr SE
- 1800 Mill Creek Rd Unit 8B
- 1800 Mill Creek Rd Unit 56A
- 16014 Village Green Dr Unit C
- 16101 Bothell Everett Hwy Unit B202
- 17009 17th Ave SE
- 1715 170th Place SE
- 17001 17th Ave SE
- 1704 170th Place SE
- 1712 170th Place SE
- 1725 170th Place SE Unit B
- 1725 170th Place SE Unit A
- 1723 170th Place SE Unit B
- 1723 170th Place SE Unit A
- 1721 170th Place SE Unit B
- 1721 170th Place SE Unit A
- 1719 170th Place SE Unit B
- 1719 170th Place SE Unit A
- 16923 17th Ave SE
- 17031 17th Ave SE
- 17012 17th Ave SE
- 1728 170th Place SE
- 17006 17th Ave SE
- 1720 170th Place SE
- 17024 17th Ave SE
Your Personal Tour Guide
Ask me questions while you tour the home.