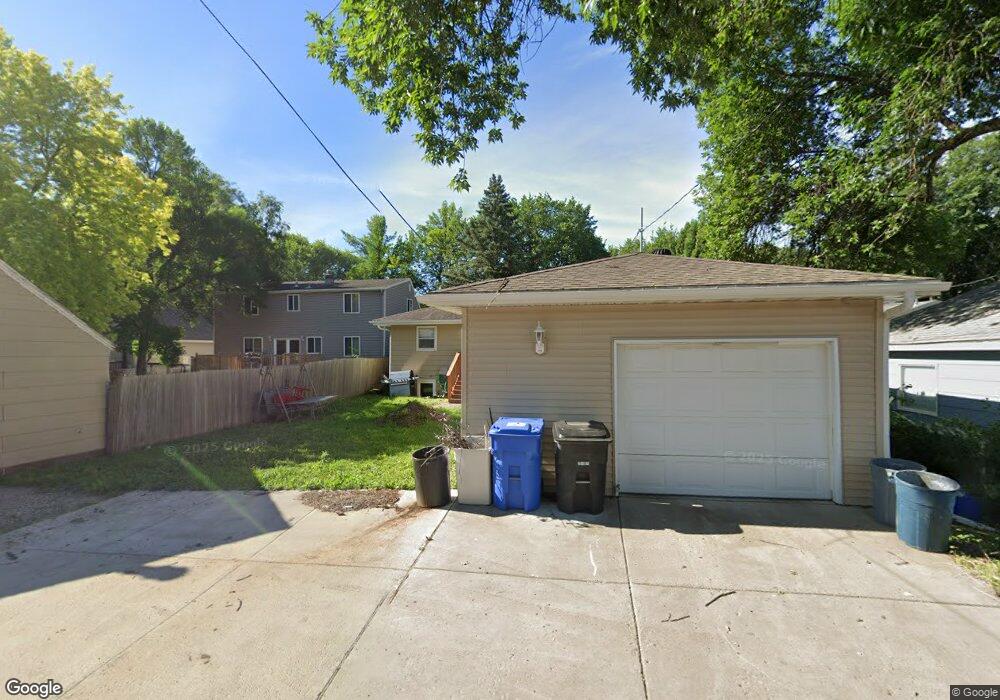
1709 6th Ave S Fargo, ND 58103
Jefferson-Carl NeighborhoodEstimated Value: $236,000 - $254,285
3
Beds
3
Baths
1,232
Sq Ft
$199/Sq Ft
Est. Value
About This Home
This home is located at 1709 6th Ave S, Fargo, ND 58103 and is currently estimated at $245,321, approximately $199 per square foot. 1709 6th Ave S is a home located in Cass County with nearby schools including Jefferson Elementary School, Carl Ben Eielson Middle School, and South High School.
Ownership History
Date
Name
Owned For
Owner Type
Purchase Details
Closed on
Jan 15, 2021
Sold by
Sunset Enterprises Llc
Bought by
Fremling Eric D
Current Estimated Value
Purchase Details
Closed on
Jan 24, 2014
Sold by
Dullum Jackie
Bought by
Arechigo Jackie and Arechigo Sam
Purchase Details
Closed on
Mar 17, 2010
Sold by
Dockter Avery E
Bought by
Dullum Jacqueline M
Home Financials for this Owner
Home Financials are based on the most recent Mortgage that was taken out on this home.
Original Mortgage
$120,500
Interest Rate
5.03%
Mortgage Type
New Conventional
Purchase Details
Closed on
May 25, 2006
Sold by
Stockmoe Stuart H and Stockmoe Sheri L
Bought by
Dullum Jacqueline M and Dockter Avery E
Home Financials for this Owner
Home Financials are based on the most recent Mortgage that was taken out on this home.
Original Mortgage
$122,003
Interest Rate
6.05%
Mortgage Type
FHA
Create a Home Valuation Report for This Property
The Home Valuation Report is an in-depth analysis detailing your home's value as well as a comparison with similar homes in the area
Home Values in the Area
Average Home Value in this Area
Purchase History
| Date | Buyer | Sale Price | Title Company |
|---|---|---|---|
| Fremling Eric D | -- | None Available | |
| Arechigo Jackie | -- | None Available | |
| Dullum Jacqueline M | -- | -- | |
| Dullum Jacqueline M | $123,700 | -- |
Source: Public Records
Mortgage History
| Date | Status | Borrower | Loan Amount |
|---|---|---|---|
| Previous Owner | Dullum Jacqueline M | $120,500 | |
| Previous Owner | Dullum Jacqueline M | $122,003 |
Source: Public Records
Tax History Compared to Growth
Tax History
| Year | Tax Paid | Tax Assessment Tax Assessment Total Assessment is a certain percentage of the fair market value that is determined by local assessors to be the total taxable value of land and additions on the property. | Land | Improvement |
|---|---|---|---|---|
| 2024 | $3,340 | $117,450 | $19,550 | $97,900 |
| 2023 | $3,531 | $110,800 | $19,550 | $91,250 |
| 2022 | $3,054 | $105,500 | $19,550 | $85,950 |
| 2021 | $2,806 | $98,150 | $19,550 | $78,600 |
| 2020 | $2,670 | $98,150 | $19,550 | $78,600 |
| 2019 | $2,274 | $82,550 | $11,600 | $70,950 |
| 2018 | $2,216 | $82,550 | $11,600 | $70,950 |
| 2017 | $2,193 | $82,550 | $11,600 | $70,950 |
| 2016 | $1,988 | $82,550 | $11,600 | $70,950 |
| 2015 | $1,877 | $72,950 | $7,950 | $65,000 |
| 2014 | $1,784 | $67,550 | $7,950 | $59,600 |
| 2013 | $1,685 | $64,350 | $7,950 | $56,400 |
Source: Public Records
Map
Nearby Homes
- 813 17th St S
- 814 19th St S
- 818 19th St S
- 1524 5th Ave S
- 1529 4th Ave S
- 2126 5th Ave S
- 1610 2nd Ave S
- 2209 6th Ave S
- 1629 2nd Ave S
- 2213 5th Ave S
- 1517 9th Ave S
- 402 23rd St S
- 1419 5th Ave S
- 1425 4th Ave S
- 1524 1st Ave S
- 207 22nd St S
- 1450 1st Ave S
- 1129 22nd St S Unit B09
- 1129 22nd St S Unit B12
- 1414 10th Ave S
- 1721 6th Ave S
- 1707 6th Ave S
- 1725 6th Ave S
- 1705 6th Ave S
- 1729 6th Ave S
- 1703 6th Ave S
- 1718 5th Ave S
- 1722 5th Ave S
- 1714 5th Ave S
- 1802 5th Ave S
- 1710 5th Ave S
- 517 17th St S
- 1718 6th Ave S
- 1714 6th Ave S
- 1801 6th Ave S
- 1801 6th Ave S Unit A
- 1801 6th Ave S Unit B
- 1804 5th Ave S
- 1706 5th Ave S
- 1722 6th Ave S