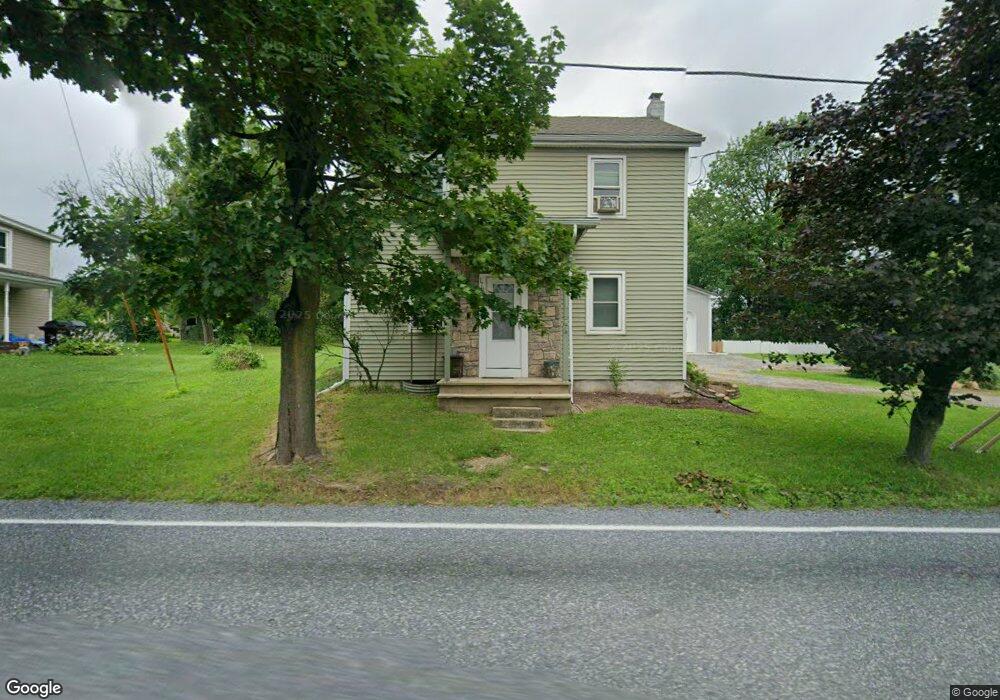
1709 Chestnut St New Ringgold, PA 17960
Estimated Value: $203,000 - $344,000
3
Beds
2
Baths
1,376
Sq Ft
$182/Sq Ft
Est. Value
About This Home
This home is located at 1709 Chestnut St, New Ringgold, PA 17960 and is currently estimated at $251,001, approximately $182 per square foot. 1709 Chestnut St is a home located in Schuylkill County with nearby schools including Blue Mountain High School.
Ownership History
Date
Name
Owned For
Owner Type
Purchase Details
Closed on
Nov 24, 2010
Sold by
Hine David M and Hine Debra A
Bought by
Perlaki Joel W
Current Estimated Value
Home Financials for this Owner
Home Financials are based on the most recent Mortgage that was taken out on this home.
Original Mortgage
$1,350,800
Outstanding Balance
$889,874
Interest Rate
4.24%
Mortgage Type
New Conventional
Estimated Equity
-$638,873
Purchase Details
Closed on
Dec 9, 2009
Sold by
Eifert Melissa M
Bought by
Hine David M and Hine Debra A
Home Financials for this Owner
Home Financials are based on the most recent Mortgage that was taken out on this home.
Original Mortgage
$50,000
Interest Rate
5.02%
Mortgage Type
Purchase Money Mortgage
Purchase Details
Closed on
Feb 7, 2009
Sold by
Eifert Daniel D and Eifert Melissa M
Bought by
Eiffert Melissa M
Purchase Details
Closed on
Sep 20, 2007
Sold by
Schuykill County Of Tax Claim Bureau
Bought by
Eifert Melissa M
Create a Home Valuation Report for This Property
The Home Valuation Report is an in-depth analysis detailing your home's value as well as a comparison with similar homes in the area
Home Values in the Area
Average Home Value in this Area
Purchase History
| Date | Buyer | Sale Price | Title Company |
|---|---|---|---|
| Perlaki Joel W | $142,982 | None Available | |
| Hine David M | $115,000 | None Available | |
| Eiffert Melissa M | -- | None Available | |
| Eifert Melissa M | $9,200 | None Available |
Source: Public Records
Mortgage History
| Date | Status | Borrower | Loan Amount |
|---|---|---|---|
| Open | Perlaki Joel W | $1,350,800 | |
| Previous Owner | Hine David M | $50,000 |
Source: Public Records
Tax History Compared to Growth
Tax History
| Year | Tax Paid | Tax Assessment Tax Assessment Total Assessment is a certain percentage of the fair market value that is determined by local assessors to be the total taxable value of land and additions on the property. | Land | Improvement |
|---|---|---|---|---|
| 2025 | $3,568 | $52,030 | $25,550 | $26,480 |
| 2024 | $3,321 | $52,030 | $25,550 | $26,480 |
| 2023 | $3,321 | $52,030 | $25,550 | $26,480 |
| 2022 | $3,321 | $52,030 | $25,550 | $26,480 |
| 2021 | $3,270 | $52,030 | $25,550 | $26,480 |
| 2020 | $3,174 | $52,030 | $25,550 | $26,480 |
| 2018 | $3,062 | $52,030 | $25,550 | $26,480 |
| 2017 | $3,010 | $52,030 | $25,550 | $26,480 |
| 2015 | -- | $52,030 | $25,550 | $26,480 |
| 2011 | -- | $47,840 | $0 | $0 |
Source: Public Records
Map
Nearby Homes
- 22 Hughes St
- 0 Wild Turkey Ln Unit PASK2023694
- Lot 5 Wild Turkey Ln
- Lot 4 Wild Turkey Ln
- 139 White Birch Rd
- 38 White Birch Rd
- 535 Coal Mountain Rd
- 1319 Shady Ln
- 102 S Hickory St
- 521 Lake Front Dr
- 2101 Village Rd
- 904 Village Rd
- 401 Village Rd
- 405 Village Rd
- 76 Shiloh Rd
- 18 Dayspring Dr
- 31 Cornerstone Dr
- 28 Dayspring Dr
- 35 Cornerstone Dr
- 23 Dayspring Dr
- 1705 Chestnut St
- 1719 Chestnut St
- 1727 Chestnut St
- 19 Gamelands Rd
- 1710 Chestnut St
- 0 Gamelands Rd
- 1731 Chestnut St
- 1734 Chestnut St
- 1735 Chestnut St
- 25 Gamelands Rd
- 1739 Chestnut St
- 5 S Vine St
- 9 Gamelands Rd
- 1679 Chestnut St
- 1751 Chestnut St
- 1674 Chestnut St
- 11 N Race St
- 1673 (lot 2) Chestnut St
- 1675 (lot 2) Chestnut St
- 1701 Chestnut St