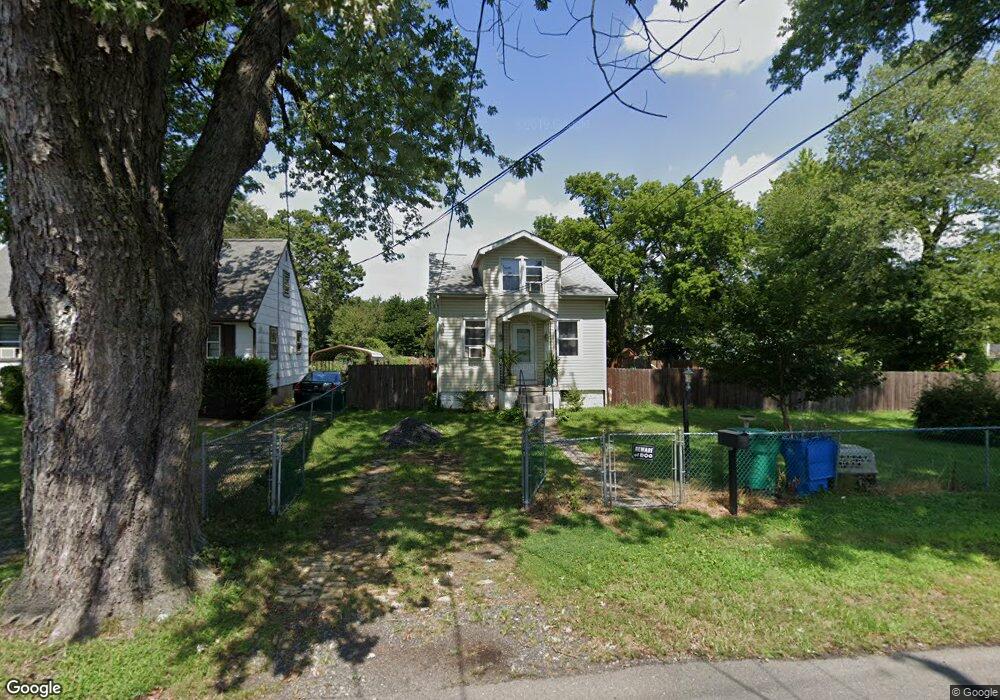
1709 Dixon Ave Croydon, PA 19021
Estimated Value: $271,000 - $323,000
3
Beds
2
Baths
870
Sq Ft
$346/Sq Ft
Est. Value
About This Home
This home is located at 1709 Dixon Ave, Croydon, PA 19021 and is currently estimated at $301,306, approximately $346 per square foot. 1709 Dixon Ave is a home located in Bucks County with nearby schools including Truman Senior High School, School Lane Charter School, and St. Mark Elementary School.
Ownership History
Date
Name
Owned For
Owner Type
Purchase Details
Closed on
Dec 11, 2008
Sold by
Top Properties Llc
Bought by
Sims Chuck and Harrington Stacey
Current Estimated Value
Home Financials for this Owner
Home Financials are based on the most recent Mortgage that was taken out on this home.
Original Mortgage
$160,876
Outstanding Balance
$107,023
Interest Rate
6.27%
Mortgage Type
FHA
Estimated Equity
$194,283
Purchase Details
Closed on
Jan 3, 2008
Sold by
Ficco Nicole and Paulinski Christopher
Bought by
Top Properties Llc
Purchase Details
Closed on
Jan 7, 2005
Sold by
Atkinson Dennis I
Bought by
Paulinski Christopher and Ficco Nicole
Home Financials for this Owner
Home Financials are based on the most recent Mortgage that was taken out on this home.
Original Mortgage
$142,500
Interest Rate
7.99%
Mortgage Type
Fannie Mae Freddie Mac
Purchase Details
Closed on
Jul 31, 1998
Sold by
Gorelick Ruthanne Marie and Haines Thomas M
Bought by
Atkinson Dennis I
Home Financials for this Owner
Home Financials are based on the most recent Mortgage that was taken out on this home.
Original Mortgage
$58,500
Interest Rate
6.94%
Create a Home Valuation Report for This Property
The Home Valuation Report is an in-depth analysis detailing your home's value as well as a comparison with similar homes in the area
Home Values in the Area
Average Home Value in this Area
Purchase History
| Date | Buyer | Sale Price | Title Company |
|---|---|---|---|
| Sims Chuck | $163,000 | None Available | |
| Top Properties Llc | $120,100 | None Available | |
| Paulinski Christopher | $150,000 | -- | |
| Atkinson Dennis I | $88,500 | -- |
Source: Public Records
Mortgage History
| Date | Status | Borrower | Loan Amount |
|---|---|---|---|
| Open | Sims Chuck | $160,876 | |
| Previous Owner | Paulinski Christopher | $142,500 | |
| Previous Owner | Atkinson Dennis I | $58,500 |
Source: Public Records
Tax History Compared to Growth
Tax History
| Year | Tax Paid | Tax Assessment Tax Assessment Total Assessment is a certain percentage of the fair market value that is determined by local assessors to be the total taxable value of land and additions on the property. | Land | Improvement |
|---|---|---|---|---|
| 2025 | $3,476 | $12,800 | $4,960 | $7,840 |
| 2024 | $3,476 | $12,800 | $4,960 | $7,840 |
| 2023 | $3,450 | $12,800 | $4,960 | $7,840 |
| 2022 | $3,450 | $12,800 | $4,960 | $7,840 |
| 2021 | $3,450 | $12,800 | $4,960 | $7,840 |
| 2020 | $3,450 | $12,800 | $4,960 | $7,840 |
| 2019 | $3,438 | $12,800 | $4,960 | $7,840 |
| 2018 | $3,382 | $12,800 | $4,960 | $7,840 |
| 2017 | $3,331 | $12,800 | $4,960 | $7,840 |
| 2016 | $3,331 | $12,800 | $4,960 | $7,840 |
| 2015 | $2,583 | $12,800 | $4,960 | $7,840 |
| 2014 | $2,583 | $12,800 | $4,960 | $7,840 |
Source: Public Records
Map
Nearby Homes
- 1706 Spencer Dr
- 200 Janet Ave
- 1012 Franklin Ave
- 1000 Stephen Ave
- 2133 Maple Ave
- 10 McLevins Ct
- 1 McLevins Ct
- 0 Newportville Rd Unit PABU487252
- 906 Stephen Ave
- L:15 Dunston Rd
- 2349 Dixon Ave
- 1206 Sycamore Ave
- 1502 Moore St Unit 201
- 509 Neshaminy Rd
- 801 Cliff Rd
- 910 Magnolia Ave
- 1000 Main Ave
- 2307 State Rd
- 311 Neshaminy Rd
- 405 Cedar Ave