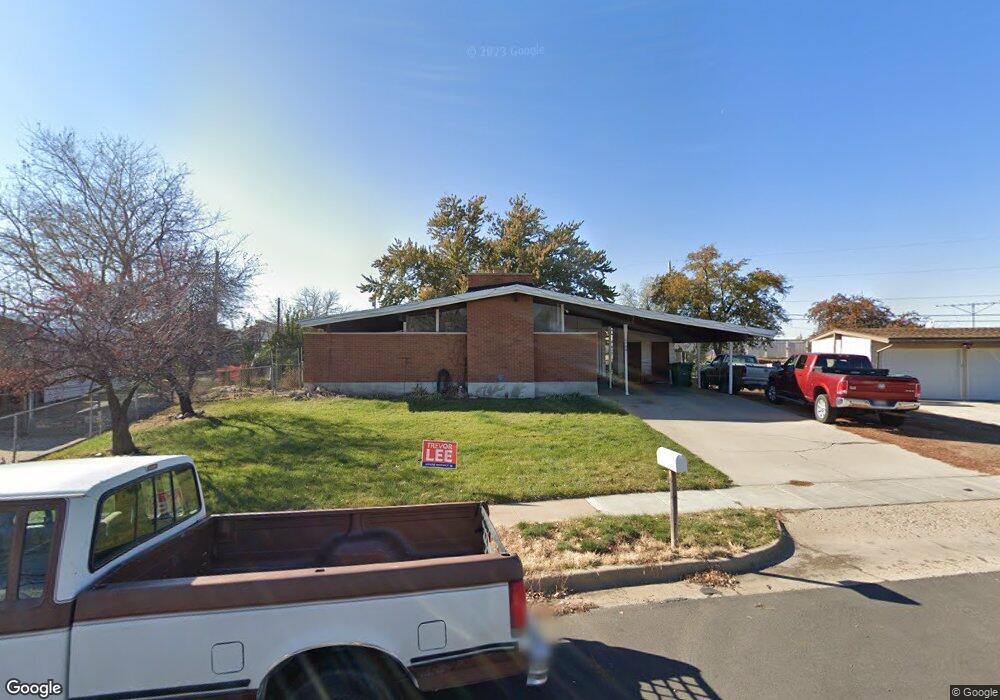
1709 Forbes Ave W Layton, UT 84041
Estimated Value: $412,000 - $536,000
4
Beds
2
Baths
2,648
Sq Ft
$177/Sq Ft
Est. Value
About This Home
This home is located at 1709 Forbes Ave W, Layton, UT 84041 and is currently estimated at $467,555, approximately $176 per square foot. 1709 Forbes Ave W is a home located in Davis County with nearby schools including Lincoln Elementary School, North Layton Junior High School, and Northridge High School.
Ownership History
Date
Name
Owned For
Owner Type
Purchase Details
Closed on
Jan 3, 2018
Sold by
Franklin Kierstyn
Bought by
Swain Scott Andrew and Swain Jessica
Current Estimated Value
Purchase Details
Closed on
Jan 12, 2016
Sold by
Mossa Llc
Bought by
Franklin Kierstyn
Purchase Details
Closed on
Apr 27, 1999
Sold by
Scott Toby T and Scott Charlotte C
Bought by
Sanchez James R and Sanchez Tiffany A
Home Financials for this Owner
Home Financials are based on the most recent Mortgage that was taken out on this home.
Original Mortgage
$111,625
Interest Rate
6.98%
Mortgage Type
Purchase Money Mortgage
Create a Home Valuation Report for This Property
The Home Valuation Report is an in-depth analysis detailing your home's value as well as a comparison with similar homes in the area
Home Values in the Area
Average Home Value in this Area
Purchase History
| Date | Buyer | Sale Price | Title Company |
|---|---|---|---|
| Swain Scott Andrew | -- | Us Title | |
| Franklin Kierstyn | -- | Founders Title | |
| Sanchez James R | -- | First American Title Co |
Source: Public Records
Mortgage History
| Date | Status | Borrower | Loan Amount |
|---|---|---|---|
| Previous Owner | Sanchez James R | $111,625 |
Source: Public Records
Tax History Compared to Growth
Tax History
| Year | Tax Paid | Tax Assessment Tax Assessment Total Assessment is a certain percentage of the fair market value that is determined by local assessors to be the total taxable value of land and additions on the property. | Land | Improvement |
|---|---|---|---|---|
| 2025 | $1,966 | $211,200 | $128,294 | $82,906 |
| 2024 | $1,966 | $207,900 | $147,733 | $60,167 |
| 2023 | $2,012 | $375,000 | $160,170 | $214,830 |
| 2022 | $2,032 | $205,700 | $89,204 | $116,496 |
| 2021 | $1,934 | $292,000 | $138,021 | $153,979 |
| 2020 | $1,761 | $255,000 | $110,577 | $144,423 |
| 2019 | $1,664 | $236,000 | $100,199 | $135,801 |
| 2018 | $1,573 | $224,000 | $100,199 | $123,801 |
| 2016 | $1,313 | $96,470 | $35,543 | $60,927 |
| 2015 | $1,213 | $84,590 | $35,543 | $49,047 |
| 2014 | $1,179 | $84,059 | $35,543 | $48,516 |
| 2013 | -- | $85,409 | $26,925 | $58,484 |
Source: Public Records
Map
Nearby Homes
- 1676 Forbes Ave W
- 398 Paul Ave
- 1837 N 440 W
- 1500 N Angel St Unit 12
- 1500 N Angel St Unit 64
- 1490 N 175 W
- 1094 N Angel St W
- 1644 N 160 W
- 1908 N 200 W
- 1615 N Angel St Unit F
- 1615 N Angel St Unit I
- 1615 N Angel St Unit E
- 1615 N Angel St Unit B
- 1615 N Angel St
- 1615 N Angel St Unit C
- 1615 N Angel St Unit H
- 1615 N Angel St Unit A
- 1615 N Angel St Unit G
- 1615 N Angel St Unit D
- 2187 N 450 W
- 1709 N Forbes St
- 1709 Forbes St
- 1719 Forbes St
- 1701 N Forbes St
- 1701 Forbes St
- 640 Delayne Cir
- 656 Delayne Cir
- 1712 Forbes St
- 1725 Forbes St
- 1724 Forbes St
- 1725 N Forbes St
- 1700 Forbes St
- 660 W 1800 N
- 677 W 1800 N
- 631 W 1800 N
- 1736 Forbes St
- 1735 Forbes St
- 1688 W Forbes St
- 1736 N Forbes St
- 1688 Forbes St