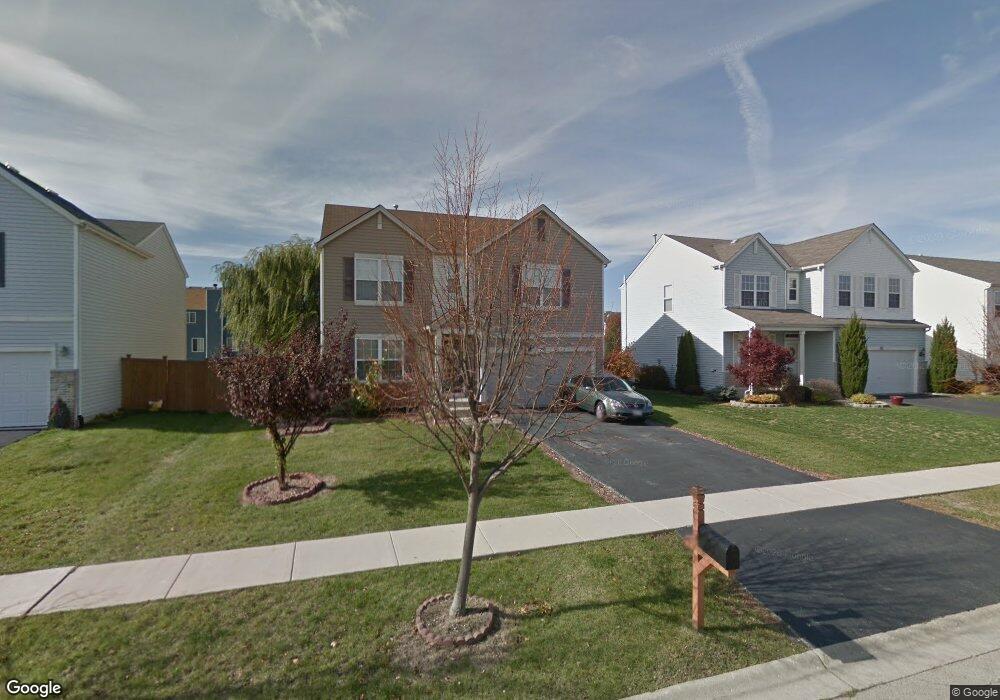
1709 Mountain Ridge Pass Plainfield, IL 60586
Fall Creek NeighborhoodEstimated Value: $398,387 - $420,000
4
Beds
4
Baths
2,564
Sq Ft
$160/Sq Ft
Est. Value
About This Home
This home is located at 1709 Mountain Ridge Pass, Plainfield, IL 60586 and is currently estimated at $410,097, approximately $159 per square foot. 1709 Mountain Ridge Pass is a home located in Will County with nearby schools including Ridge Elementary School, Drauden Point Middle School, and Plainfield South High School.
Ownership History
Date
Name
Owned For
Owner Type
Purchase Details
Closed on
Feb 14, 2014
Sold by
Peralta Elvia
Bought by
Tapia Josue
Current Estimated Value
Purchase Details
Closed on
Sep 14, 2011
Sold by
Garcia Olmeda Elvia and Olmeda Arnulfo
Bought by
Peralta Elvia
Purchase Details
Closed on
Sep 18, 2006
Sold by
Rayo Amilcar Ivan
Bought by
Peralta Elvia and Olmeda Arnulfo
Home Financials for this Owner
Home Financials are based on the most recent Mortgage that was taken out on this home.
Original Mortgage
$208,000
Interest Rate
8.12%
Mortgage Type
Balloon
Purchase Details
Closed on
Oct 8, 2004
Sold by
Neumann Homes Inc
Bought by
Rayo Amilcar Ivan
Home Financials for this Owner
Home Financials are based on the most recent Mortgage that was taken out on this home.
Original Mortgage
$214,058
Interest Rate
6.99%
Mortgage Type
Purchase Money Mortgage
Create a Home Valuation Report for This Property
The Home Valuation Report is an in-depth analysis detailing your home's value as well as a comparison with similar homes in the area
Home Values in the Area
Average Home Value in this Area
Purchase History
| Date | Buyer | Sale Price | Title Company |
|---|---|---|---|
| Tapia Josue | $145,000 | Old Republic National Title | |
| Peralta Elvia | -- | None Available | |
| Peralta Elvia | $260,000 | Ticor Title | |
| Rayo Amilcar Ivan | $225,500 | Chicago Title Insurance Co |
Source: Public Records
Mortgage History
| Date | Status | Borrower | Loan Amount |
|---|---|---|---|
| Previous Owner | Peralta Elvia | $208,000 | |
| Previous Owner | Rayo Amilcar Ivan | $214,058 |
Source: Public Records
Tax History
| Year | Tax Paid | Tax Assessment Tax Assessment Total Assessment is a certain percentage of the fair market value that is determined by local assessors to be the total taxable value of land and additions on the property. | Land | Improvement |
|---|---|---|---|---|
| 2024 | $7,627 | $114,206 | $21,244 | $92,962 |
| 2023 | $7,627 | $103,148 | $19,187 | $83,961 |
| 2022 | $7,409 | $92,641 | $17,233 | $75,408 |
| 2021 | $6,449 | $86,581 | $16,106 | $70,475 |
| 2020 | $6,447 | $84,125 | $15,649 | $68,476 |
| 2019 | $6,129 | $80,157 | $14,911 | $65,246 |
| 2018 | $5,864 | $75,311 | $14,009 | $61,302 |
| 2017 | $5,687 | $71,568 | $13,313 | $58,255 |
| 2016 | $5,570 | $68,257 | $12,697 | $55,560 |
| 2015 | $5,194 | $63,941 | $11,894 | $52,047 |
| 2014 | $5,194 | $61,683 | $11,474 | $50,209 |
| 2013 | $5,194 | $61,683 | $11,474 | $50,209 |
Source: Public Records
Map
Nearby Homes
- 1808 Castle Ridge Dr
- 1605 Cascade Ridge Dr Unit 3
- 1808 Legacy Pointe Blvd
- 1814 Legacy Pointe Blvd
- 1819 Legacy Pointe Blvd
- 1616 Stanton Ln
- 6713 Applegate Dr
- 6715 Applegate Dr
- 1805 Overland Dr
- 1804 Overland Dr
- 1807 Overland Dr
- 1806 Overland Dr
- 6702 Buchanan Cir
- 6704 Buchanan Cir
- 6701 Buchanan Cir
- 1800 Overland Dr
- 1803 Overland Dr
- 1802 Overland Dr
- 1801 Overland Dr
- 1810 Overland Dr
- 1707 Mountain Ridge Pass
- 1713 Mountain Ridge Pass Unit 3
- 1705 Mountain Ridge Pass
- 1708 Cascade Ridge Dr
- 1710 Cascade Ridge Dr Unit 3
- 1706 Cascade Ridge Dr
- 1712 Cascade Ridge Dr Unit 3
- 1715 Mountain Ridge Pass Unit 3
- 1703 Mountain Ridge Pass
- 1710 Mountain Ridge Pass Unit 3
- 1708 Mountain Ridge Pass Unit 3
- 1712 Mountain Ridge Pass Unit 3
- 1706 Mountain Ridge Pass Unit 3
- 1702 Cascade Ridge Dr Unit 3
- 1714 Cascade Ridge Dr Unit 3
- 1714 Mountain Ridge Pass
- 1704 Mountain Ridge Pass Unit 3
- 1701 Mountain Ridge Pass
- 1717 Mountain Ridge Pass Unit 3
- 1700 Cascade Ridge Dr Unit 3
Your Personal Tour Guide
Ask me questions while you tour the home.