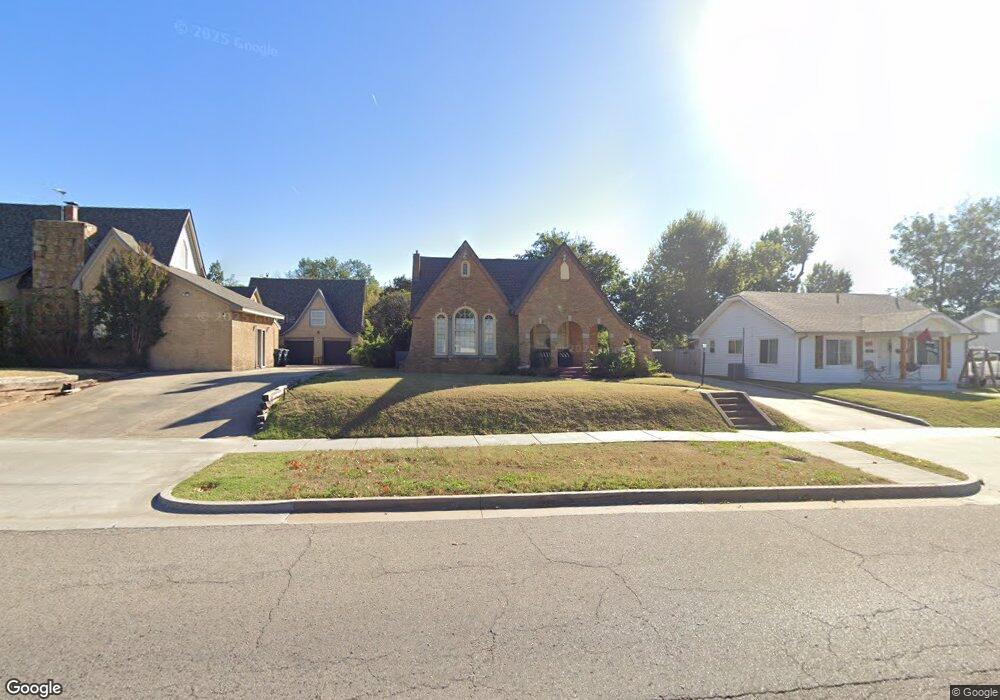
1709 N Bdwy Shawnee, OK 74804
Estimated Value: $199,237 - $221,000
3
Beds
2
Baths
2,065
Sq Ft
$102/Sq Ft
Est. Value
About This Home
This home is located at 1709 N Bdwy, Shawnee, OK 74804 and is currently estimated at $210,809, approximately $102 per square foot. 1709 N Bdwy is a home with nearby schools including Sequoyah Elementary School, Shawnee Middle School, and Shawnee High School.
Ownership History
Date
Name
Owned For
Owner Type
Purchase Details
Closed on
Jun 12, 2014
Sold by
Grinnell Jo Ann
Bought by
Lewellen Courtney
Current Estimated Value
Purchase Details
Closed on
Dec 5, 2010
Sold by
Grinnell Earl F and Grinnell Jo A
Bought by
Grinnell Jo Ann
Purchase Details
Closed on
Nov 26, 1997
Sold by
Barton Dortha
Bought by
Grinnell Earl and Jo Ann
Create a Home Valuation Report for This Property
The Home Valuation Report is an in-depth analysis detailing your home's value as well as a comparison with similar homes in the area
Home Values in the Area
Average Home Value in this Area
Purchase History
| Date | Buyer | Sale Price | Title Company |
|---|---|---|---|
| Lewellen Courtney | $128,500 | -- | |
| Grinnell Jo Ann | -- | -- | |
| Grinnell Earl | $89,500 | -- |
Source: Public Records
Tax History Compared to Growth
Tax History
| Year | Tax Paid | Tax Assessment Tax Assessment Total Assessment is a certain percentage of the fair market value that is determined by local assessors to be the total taxable value of land and additions on the property. | Land | Improvement |
|---|---|---|---|---|
| 2024 | $1,509 | $15,644 | $1,200 | $14,444 |
| 2023 | $1,587 | $15,189 | $1,200 | $13,989 |
| 2022 | $1,558 | $15,189 | $1,200 | $13,989 |
| 2021 | $1,476 | $14,649 | $1,125 | $13,524 |
| 2020 | $1,509 | $14,939 | $1,125 | $13,814 |
| 2019 | $1,560 | $14,939 | $1,125 | $13,814 |
| 2018 | $1,508 | $14,734 | $1,125 | $13,609 |
| 2017 | $1,416 | $14,032 | $1,125 | $12,907 |
| 2016 | $1,472 | $14,426 | $1,125 | $13,301 |
| 2015 | $1,542 | $15,420 | $1,440 | $13,980 |
| 2014 | $716 | $8,161 | $556 | $7,605 |
Source: Public Records
Map
Nearby Homes
- 1816 N Bell Ave
- 1607 N Beard Ave
- 1817 N Bell Ave
- 1510 N Union Ave
- 210 E Cammack
- 1901 N Bell Ave
- 1822 N Philadelphia Ave
- 1834 N Market Ave
- 1710 N Park Ave
- 2021 N Broadway Ave
- 1925 N Park Ave
- 1324 N Park Ave
- 1217 N Market Ave
- 1539 N Pennsylvania Ave
- 1712 N Pennsylvania Ave
- 0 Independence and Minnesota St
- 202 W Franklin St
- 10 W Midland St
- 1017 N Bdwy Ave
- 1006 N Market Ave
- 1717 N Broadway Ave
- 1703 N Bdwy Ave
- 1725 N Bdwy
- 1720 N Bell Ave
- 15 E Cammack
- 30 E Elizabeth St Unit SHA
- 1708 N Bdwy
- 1708 N Broadway Ave
- 1720 N Bdwy
- 1730 N Broadway Ave
- 1709 N Broadway Ave
- 1705 N Broadway Ave
- 1702 N Bdwy Ave
- 1703 N Broadway Ave
- 1701 N Broadway Ave
- 1730 N Bell Ave
- 0 N Bell Ave
- 4 E Cammack St
- 1630 N Broadway Ave
- 1801 N Bdwy