1709 NW Main St Gentry, AR 72734
Estimated Value: $485,000 - $538,000
Studio
2
Baths
2,022
Sq Ft
$251/Sq Ft
Est. Value
About This Home
This home is located at 1709 NW Main St, Gentry, AR 72734 and is currently estimated at $506,855, approximately $250 per square foot. 1709 NW Main St is a home located in Benton County with nearby schools including Gentry Intermediate School, Gentry Primary School, and Gentry Middle School.
Ownership History
Date
Name
Owned For
Owner Type
Purchase Details
Closed on
Aug 4, 2021
Sold by
Hamilton Peggy J
Bought by
Tovilla Audiel Bonilla and Franzel Karen Bonilla
Current Estimated Value
Home Financials for this Owner
Home Financials are based on the most recent Mortgage that was taken out on this home.
Original Mortgage
$356,250
Outstanding Balance
$323,041
Interest Rate
3%
Mortgage Type
New Conventional
Estimated Equity
$183,814
Purchase Details
Closed on
Feb 26, 2008
Sold by
Arvest Bank
Bought by
Hamilton Peggy J
Purchase Details
Closed on
Dec 13, 2007
Sold by
Pool John R and Pool Jodye M
Bought by
Arvest Bank
Purchase Details
Closed on
Mar 3, 2004
Bought by
Pool
Purchase Details
Closed on
Apr 21, 2003
Bought by
Kelly D
Purchase Details
Closed on
Mar 23, 1999
Bought by
Brown and Churan-Kelly
Purchase Details
Closed on
Oct 9, 1997
Bought by
Brown and Churan
Purchase Details
Closed on
Aug 27, 1992
Bought by
White D D
Create a Home Valuation Report for This Property
The Home Valuation Report is an in-depth analysis detailing your home's value as well as a comparison with similar homes in the area
Purchase History
| Date | Buyer | Sale Price | Title Company |
|---|---|---|---|
| Tovilla Audiel Bonilla | $375,000 | City Title & Closing | |
| Hamilton Peggy J | $230,000 | None Available | |
| Arvest Bank | $215,000 | None Available | |
| Pool | $460,000 | -- | |
| Pool | $460,000 | -- | |
| Kelly D | -- | -- | |
| Brown | $416,000 | -- | |
| Brown | $400,000 | -- | |
| White D D | $150,000 | -- |
Source: Public Records
Mortgage History
| Date | Status | Borrower | Loan Amount |
|---|---|---|---|
| Open | Tovilla Audiel Bonilla | $356,250 |
Source: Public Records
Tax History
| Year | Tax Paid | Tax Assessment Tax Assessment Total Assessment is a certain percentage of the fair market value that is determined by local assessors to be the total taxable value of land and additions on the property. | Land | Improvement |
|---|---|---|---|---|
| 2025 | $3,583 | $94,023 | $27,666 | $66,357 |
| 2024 | $3,243 | $94,023 | $27,666 | $66,357 |
| 2023 | $3,258 | $59,228 | $18,984 | $40,244 |
| 2022 | $3,432 | $59,228 | $18,984 | $40,244 |
| 2021 | $1,402 | $43,820 | $3,580 | $40,240 |
| 2020 | $1,410 | $32,000 | $2,630 | $29,370 |
| 2019 | $1,410 | $32,000 | $2,630 | $29,370 |
| 2018 | $1,435 | $32,000 | $2,630 | $29,370 |
| 2017 | $1,435 | $32,000 | $2,630 | $29,370 |
| 2016 | $1,435 | $32,000 | $2,630 | $29,370 |
| 2015 | $1,689 | $30,700 | $2,260 | $28,440 |
| 2014 | $1,339 | $30,700 | $2,260 | $28,440 |
Source: Public Records
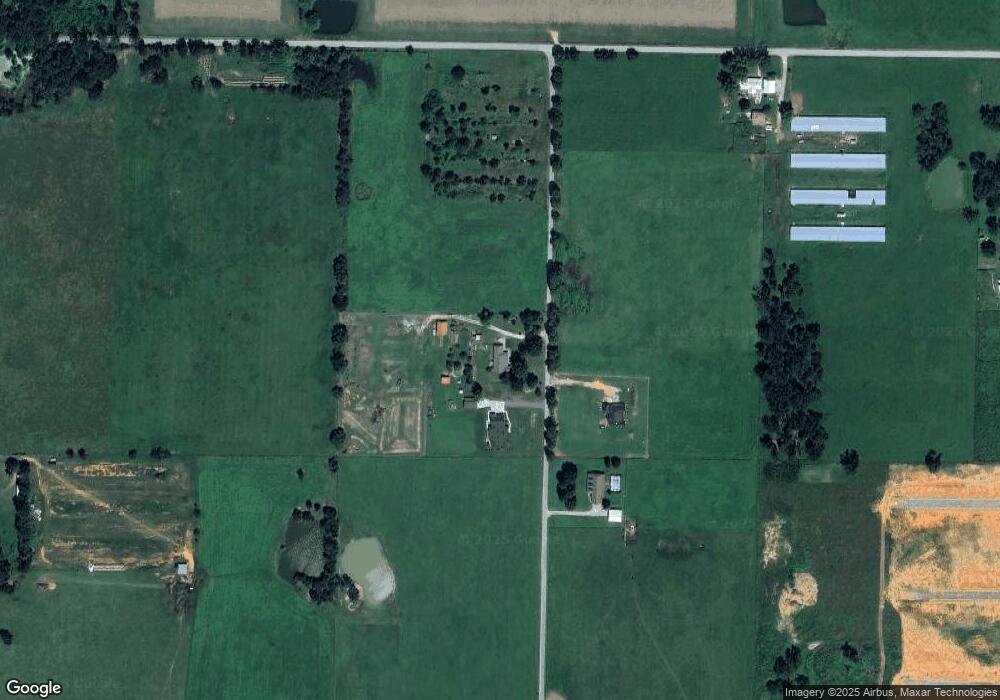
Map
Nearby Homes
- 1257 NW Malone Rd
- 954 NW Main St
- 11881 Walker St
- 0 Walker St
- Lots 2, 3, 9 & 10 Snyder Estates Rurban Phase 3
- 207 W Pinwheel St
- 304 NW Bellflower St
- 1651 W Highway 12
- 796 NW Holland Ave
- 511 NW Cowan Ave
- 492 NW Cowan Ave
- 9307 Digby Dr
- 9300 S Pleasant Valley Rd
- 9112 S Pleasant Valley Rd
- 9236 S Pleasant Valley Rd
- 9260 S Pleasant Valley Rd
- 13180 S Pleasant Valley Rd
- 12246 S Pleasant Valley Rd
- TBD Tract 3 S Pleasant Valley Rd
- TBD Tract 4 S Pleasant Valley Rd
- 1709 NW Main St
- 1709 NW Main St
- 11309 N Main St
- 1560 NW Main St
- 8548 N Main St
- 1927 NW Malone Rd
- 1159 NW Main St
- 2030 W Highway 12
- 2024 W Highway 12
- 2024 W Highway 12
- 1162 NW Main St
- 1502 NW Digby Dr
- 1502 NW Digby Dr
- 14868 W Highway 12
- 14868 W Ar 12 Hwy
- 1038 NW Main St Unit 11734
- 2098 W Highway 12
- 2098 Arkansas 12
- 2561 W Highway 12
- 0 E Hwy 12 Hwy Unit 499976
Your Personal Tour Guide
Ask me questions while you tour the home.