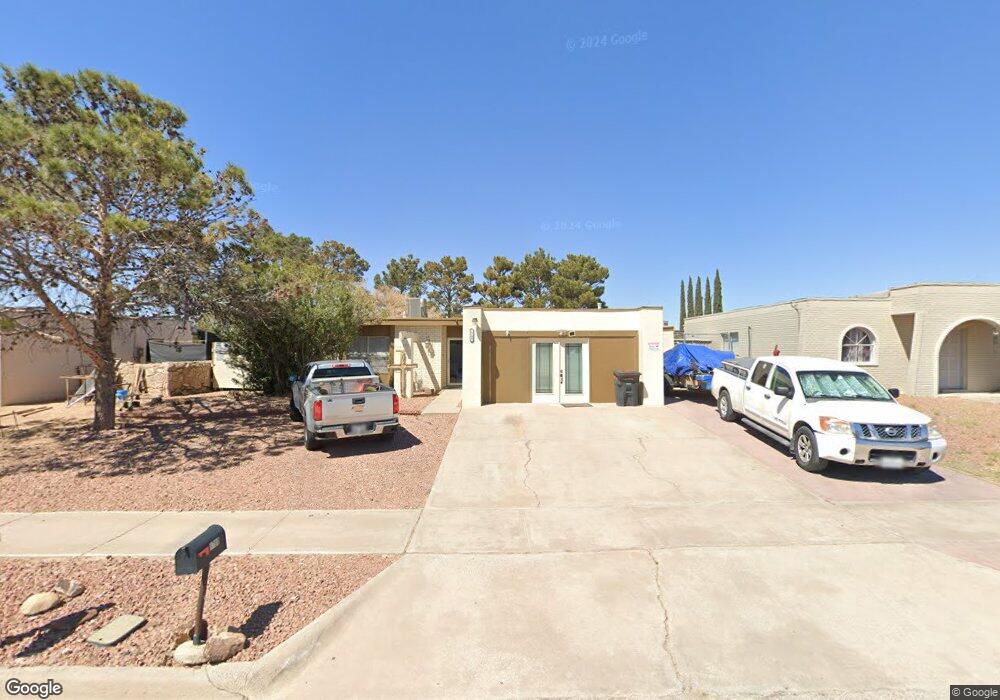
1709 Opossum Cir Horizon City, TX 79928
Estimated Value: $180,000 - $230,000
3
Beds
2
Baths
1,724
Sq Ft
$119/Sq Ft
Est. Value
About This Home
This home is located at 1709 Opossum Cir, Horizon City, TX 79928 and is currently estimated at $204,428, approximately $118 per square foot. 1709 Opossum Cir is a home located in El Paso County with nearby schools including Carroll T. Welch Elementary School, Ricardo Estrada Junior High School, and Horizon High School.
Ownership History
Date
Name
Owned For
Owner Type
Purchase Details
Closed on
Apr 24, 2021
Sold by
Ramirez Mary and Ramirez Elena
Bought by
Perez Patricia Chuca and Zavala Stephanie
Current Estimated Value
Home Financials for this Owner
Home Financials are based on the most recent Mortgage that was taken out on this home.
Original Mortgage
$70,000
Outstanding Balance
$51,800
Interest Rate
2.27%
Mortgage Type
New Conventional
Estimated Equity
$152,628
Purchase Details
Closed on
Jul 25, 2002
Sold by
Ep Core Property Company
Bought by
Vista Serena Homes Llc
Purchase Details
Closed on
Jul 14, 1999
Sold by
Brown Elizabeth E and Brown Elizabeth Eddy
Bought by
Perez Ricardo and Perez Rosa I
Home Financials for this Owner
Home Financials are based on the most recent Mortgage that was taken out on this home.
Original Mortgage
$59,918
Interest Rate
7.39%
Mortgage Type
FHA
Create a Home Valuation Report for This Property
The Home Valuation Report is an in-depth analysis detailing your home's value as well as a comparison with similar homes in the area
Home Values in the Area
Average Home Value in this Area
Purchase History
| Date | Buyer | Sale Price | Title Company |
|---|---|---|---|
| Perez Patricia Chuca | $85,000 | None Available | |
| Vista Serena Homes Llc | -- | -- | |
| Perez Ricardo | -- | -- |
Source: Public Records
Mortgage History
| Date | Status | Borrower | Loan Amount |
|---|---|---|---|
| Open | Perez Patricia Chuca | $70,000 | |
| Previous Owner | Perez Ricardo | $59,918 |
Source: Public Records
Tax History Compared to Growth
Tax History
| Year | Tax Paid | Tax Assessment Tax Assessment Total Assessment is a certain percentage of the fair market value that is determined by local assessors to be the total taxable value of land and additions on the property. | Land | Improvement |
|---|---|---|---|---|
| 2025 | $3,697 | $166,266 | -- | -- |
| 2024 | $3,697 | $151,151 | -- | -- |
| 2023 | $3,185 | $137,410 | $0 | $0 |
| 2022 | $4,050 | $124,918 | $0 | $0 |
| 2021 | $4,052 | $125,183 | $12,568 | $112,615 |
| 2020 | $3,586 | $103,238 | $12,568 | $90,670 |
| 2018 | $3,476 | $103,569 | $12,568 | $91,001 |
| 2017 | $3,154 | $94,967 | $12,568 | $82,399 |
| 2016 | $2,558 | $77,021 | $12,568 | $64,453 |
| 2015 | $2,413 | $77,021 | $12,568 | $64,453 |
| 2014 | $2,413 | $83,434 | $12,568 | $70,866 |
Source: Public Records
Map
Nearby Homes
- 15340 Mineral Ct
- TBD Horizon Blvd
- 15318 Northport Ct
- 0 Glenfield Ave Unit 925685
- 0 Ollie St Unit 898582
- 0 Omar Unit 886251
- TBD Lailey View Ct
- 156 Lago Grande Dr
- 14510 Bill Newkirk Way
- 2525 Darrington Rd
- PN-96884 Darrington Rd
- 123 Darrington Rd
- 123688 Darrington Rd
- 14520 Bill Newkirk Way
- TBD Darrington Rd
- 4 Acres Horizon Blvd
- 8 Horizon Blvd
- 240 Rami Vista
- 440 Katherine Dr
- 1100 Darrington Rd
- 1711 Opossum Cir
- 1711 Opossum Cir Unit 1
- 1711 Opossum Cir
- 1707 Opossum Cir
- TBD Opossum Cir
- 1712 Catham Cir
- 1714 Catham Cir
- 1710 Catham Cir
- 1713 Opossum Cir Unit DIR
- 1705 Opossum Cir
- 1712 Opossum Cir
- 1716 Catham Cir
- 1708 Catham Cir
- 1714 Opossum Cir
- 1708 Opossum Cir
- 1703 Opossum Cir
- 1716 Opossum Cir
- 1704 Opossum Cir
- 1704 Catham Cir
- 1718 Catham Cir