1709 Painted Sky Terrace Unit A Charlottesville, VA 22901
Estimated Value: $418,000 - $470,195
4
Beds
3
Baths
2,228
Sq Ft
$197/Sq Ft
Est. Value
About This Home
This home is located at 1709 Painted Sky Terrace Unit A, Charlottesville, VA 22901 and is currently estimated at $439,549, approximately $197 per square foot. 1709 Painted Sky Terrace Unit A is a home located in Albemarle County with nearby schools including Brownsville Elementary School, Joseph T. Henley Middle School, and Western Albemarle High School.
Ownership History
Date
Name
Owned For
Owner Type
Purchase Details
Closed on
Nov 2, 2020
Sold by
Mathews Brittany Ann and Vernam Brittany Ann
Bought by
Mathews Brittany Ann and Mathews Justin
Current Estimated Value
Home Financials for this Owner
Home Financials are based on the most recent Mortgage that was taken out on this home.
Original Mortgage
$219,000
Outstanding Balance
$194,879
Interest Rate
2.8%
Mortgage Type
New Conventional
Estimated Equity
$244,670
Purchase Details
Closed on
May 29, 2018
Sold by
Yen Linda L L and Yen Linda Ling Ling
Bought by
Vernam Brittany Ann
Home Financials for this Owner
Home Financials are based on the most recent Mortgage that was taken out on this home.
Original Mortgage
$229,600
Interest Rate
4.4%
Mortgage Type
New Conventional
Purchase Details
Closed on
Feb 10, 2013
Sold by
Lsai Linda L
Bought by
Yen Linda L L and Ling Yen Lind Ling
Create a Home Valuation Report for This Property
The Home Valuation Report is an in-depth analysis detailing your home's value as well as a comparison with similar homes in the area
Home Values in the Area
Average Home Value in this Area
Purchase History
| Date | Buyer | Sale Price | Title Company |
|---|---|---|---|
| Mathews Brittany Ann | -- | Accommodation | |
| Vernam Brittany Ann | $287,000 | Old Republic National Title | |
| Yen Linda L L | -- | None Available |
Source: Public Records
Mortgage History
| Date | Status | Borrower | Loan Amount |
|---|---|---|---|
| Open | Mathews Brittany Ann | $219,000 | |
| Previous Owner | Vernam Brittany Ann | $229,600 |
Source: Public Records
Tax History Compared to Growth
Tax History
| Year | Tax Paid | Tax Assessment Tax Assessment Total Assessment is a certain percentage of the fair market value that is determined by local assessors to be the total taxable value of land and additions on the property. | Land | Improvement |
|---|---|---|---|---|
| 2025 | $4,000 | $447,400 | $131,300 | $316,100 |
| 2024 | $3,673 | $430,100 | $124,000 | $306,100 |
| 2023 | $3,354 | $392,700 | $107,100 | $285,600 |
| 2022 | $3,142 | $367,900 | $111,900 | $256,000 |
| 2021 | $2,754 | $322,500 | $108,900 | $213,600 |
| 2020 | $2,758 | $323,000 | $102,900 | $220,100 |
| 2019 | $2,649 | $310,200 | $90,800 | $219,400 |
| 2018 | $0 | $293,100 | $90,800 | $202,300 |
| 2017 | $2,260 | $269,400 | $81,700 | $187,700 |
| 2016 | $2,276 | $271,300 | $81,700 | $189,600 |
| 2015 | $1,056 | $257,900 | $72,600 | $185,300 |
| 2014 | -- | $255,900 | $72,600 | $183,300 |
Source: Public Records
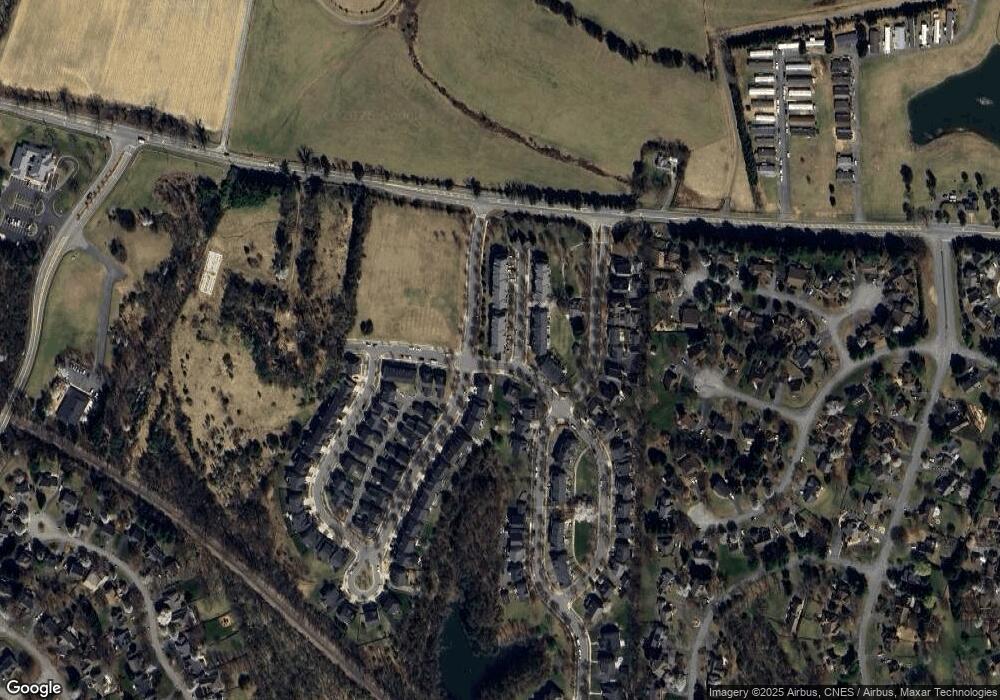
Map
Nearby Homes
- 1980 Delila Dr
- 4885 Mechums River Rd
- 4943 Lake Tree Ln
- 6131 Westhall Dr
- 920 Park Ridge Dr
- 10 Eagle View
- 10 Eagle View Unit Lot 10 Fairhill Esta
- 57-22A Old Three Notch'D Rd
- 108 Park Ridge Dr
- 103 Park Ridge Dr
- 2024 Dunwood Dr
- 2023 Meyers Way
- 770 Park Ridge Dr
- The Poplar II Plan at Glenbrook at Foothill Crossing - Townhomes
- 107 Park Ridge Dr
- 110 Park Ridge Dr
- 368 Joliet Ct
- 785 Park Ridge Dr
- 5547 Brookwood Rd
- 136 Agatha Ridge Ln
- 1709 Painted Sky Terrace Unit 1
- 1711 Painted Sky Terrace Unit 2
- 1711 Painted Sky Terrace
- 1713 Painted Sky Terrace Unit 3
- 1713 Painted Sky Terrace
- 1715 Painted Sky Terrace Unit 4
- 1715 Painted Sky Terrace
- 1717 Painted Sky Terrace Unit 5
- 1717 Painted Sky Terrace
- 1967 Wickham Way
- 1801 Wickham Place
- 1719 Painted Sky Terrace Unit 6
- 1719 Painted Sky Terrace
- 1704 Wickham Way
- 1693 Wickham Way
- 1710 Painted Sky Terrace Unit B
- 1710 Painted Sky Terrace Unit A
- 1710 Painted Sky Terrace
- 1712 Painted Sky Terrace
- 1714 Painted Sky Terrace