Estimated Value: $553,763 - $600,000
3
Beds
2
Baths
1,782
Sq Ft
$320/Sq Ft
Est. Value
About This Home
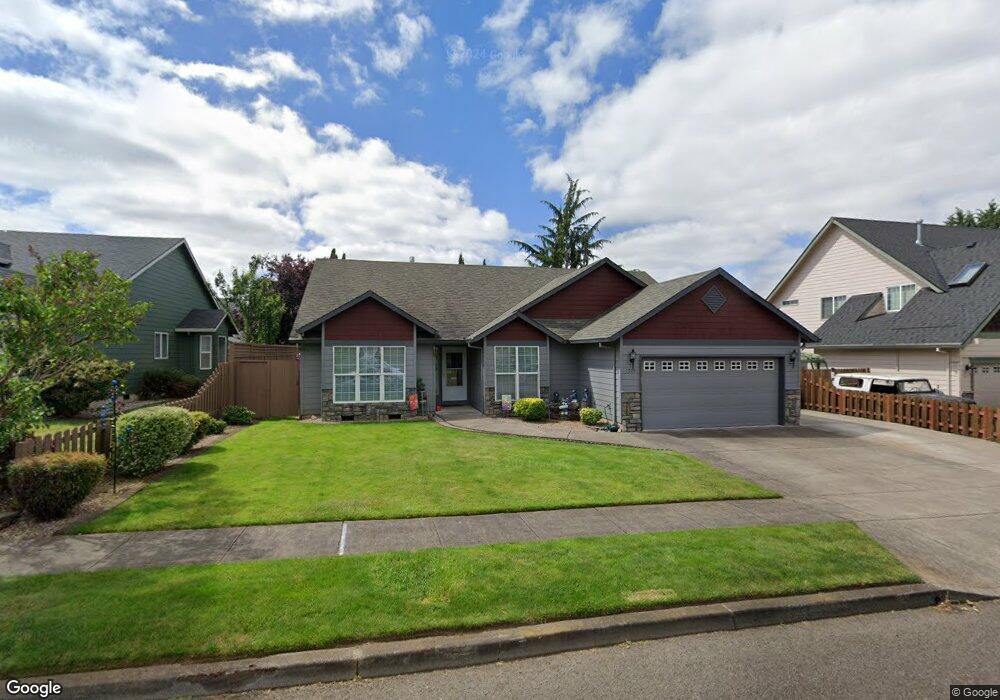
This home is located at 1709 SE 11th Place, Canby, OR 97013 and is currently estimated at $570,941, approximately $320 per square foot. 1709 SE 11th Place is a home located in Clackamas County with nearby schools including Josefa L. Sambrano Elementary School, Cecile Trost Elementary School, and Carus School.
Ownership History
Date
Name
Owned For
Owner Type
Purchase Details
Closed on
Dec 1, 2005
Sold by
Wadsworth Jeffrey C and Wadsworth Trisha L
Bought by
Elliott Edwin L and Elliott Janice D
Current Estimated Value
Home Financials for this Owner
Home Financials are based on the most recent Mortgage that was taken out on this home.
Original Mortgage
$231,200
Outstanding Balance
$128,388
Interest Rate
6.36%
Mortgage Type
Fannie Mae Freddie Mac
Estimated Equity
$442,553
Purchase Details
Closed on
Jun 28, 2001
Sold by
Beaver Homes Inc
Bought by
Wadsworth Jeffrey C and Wadsworth Trisha L
Home Financials for this Owner
Home Financials are based on the most recent Mortgage that was taken out on this home.
Original Mortgage
$186,919
Interest Rate
7.14%
Purchase Details
Closed on
Dec 29, 2000
Sold by
G Cam Ltd
Bought by
Beaver Homes Inc
Home Financials for this Owner
Home Financials are based on the most recent Mortgage that was taken out on this home.
Original Mortgage
$43,125
Interest Rate
7.71%
Mortgage Type
Construction
Create a Home Valuation Report for This Property
The Home Valuation Report is an in-depth analysis detailing your home's value as well as a comparison with similar homes in the area
Home Values in the Area
Average Home Value in this Area
Purchase History
| Date | Buyer | Sale Price | Title Company |
|---|---|---|---|
| Elliott Edwin L | $289,000 | Chicago Title Insurance Comp | |
| Wadsworth Jeffrey C | $192,700 | First American Title Co | |
| Beaver Homes Inc | $57,500 | Chicago Title Insurance Co |
Source: Public Records
Mortgage History
| Date | Status | Borrower | Loan Amount |
|---|---|---|---|
| Open | Elliott Edwin L | $231,200 | |
| Previous Owner | Wadsworth Jeffrey C | $186,919 | |
| Previous Owner | Beaver Homes Inc | $43,125 |
Source: Public Records
Tax History Compared to Growth
Tax History
| Year | Tax Paid | Tax Assessment Tax Assessment Total Assessment is a certain percentage of the fair market value that is determined by local assessors to be the total taxable value of land and additions on the property. | Land | Improvement |
|---|---|---|---|---|
| 2025 | $5,407 | $305,205 | -- | -- |
| 2024 | $5,256 | $296,316 | -- | -- |
| 2023 | $5,256 | $287,686 | $0 | $0 |
| 2022 | $4,834 | $279,307 | $0 | $0 |
| 2021 | $4,655 | $271,172 | $0 | $0 |
| 2020 | $4,572 | $263,274 | $0 | $0 |
| 2019 | $4,353 | $255,606 | $0 | $0 |
| 2018 | $4,256 | $248,161 | $0 | $0 |
| 2017 | $4,148 | $240,933 | $0 | $0 |
| 2016 | $4,010 | $233,916 | $0 | $0 |
| 2015 | $3,872 | $227,103 | $0 | $0 |
| 2014 | $3,761 | $220,488 | $0 | $0 |
Source: Public Records
Map
Nearby Homes
- 1053 S Vine St
- 1333 SE 14th Ave
- 1143 SE 17th Ave
- 1357 SE 17th Ave
- 2180 SE 11th Place
- 1460 SE 9th Ave
- 1650 S Redwood St
- 2211 SE 12th Ave
- 1660 S Redwood St
- 1072 S Walnut St
- 1321 SE 17th Ave
- 1305 SE 17th Ave
- 1259 SE 17th Ave
- 1827 S Pepperwood St
- 1821 S Pepperwood St
- 1825 S Pepperwood St
- 1823 S Pepperwood St
- 1409 S Maple St
- 575 S Ponderosa St
- 1220 SE 18th Place
- 1645 SE 11th Place
- 1719 SE 11th Place
- 1710 SE 12th Ave
- 1646 SE 12th Ave
- 1720 SE 12th Ave
- 1635 SE 11th Place
- 1731 SE 11th Place
- 1708 SE 11th Place
- 1644 SE 11th Place
- 1718 SE 11th Place
- 1636 SE 12th Ave
- 1732 SE 12th Ave
- 1634 SE 11th Place
- 1730 SE 11th Place
- 1623 SE 11th Place
- 1739 SE 11th Place
- 1626 SE 12th Ave
- 1740 SE 12th Ave
- 1624 SE 11th Place
- 1711 SE 11th Ave