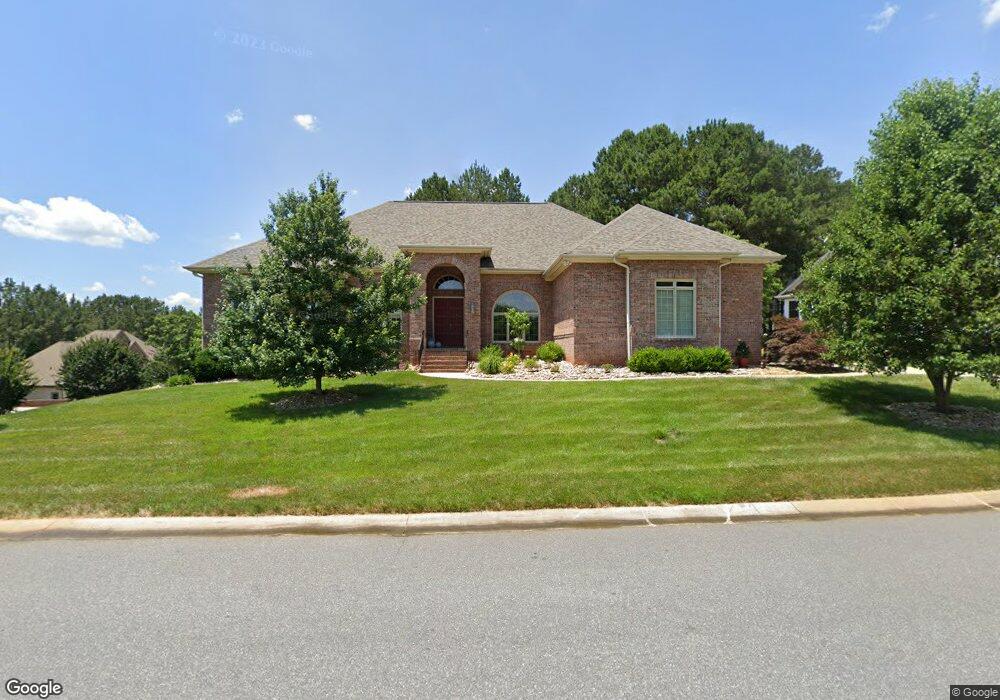
1709 Verdict Ridge Dr Denver, NC 28037
Estimated Value: $849,000 - $990,000
4
Beds
4
Baths
4,046
Sq Ft
$230/Sq Ft
Est. Value
About This Home
This home is located at 1709 Verdict Ridge Dr, Denver, NC 28037 and is currently estimated at $929,725, approximately $229 per square foot. 1709 Verdict Ridge Dr is a home located in Lincoln County with nearby schools including St. James Elementary School, East Lincoln Middle School, and East Lincoln High School.
Ownership History
Date
Name
Owned For
Owner Type
Purchase Details
Closed on
Jan 7, 2014
Sold by
Cooning Michael and Cooning Pamela
Bought by
Cooning Michael J and Pamela S Cooning J
Current Estimated Value
Purchase Details
Closed on
Sep 11, 2013
Sold by
Jones James F and Jones Ann Emory
Bought by
Cooning Michael and Cooning Pamela
Purchase Details
Closed on
Nov 7, 2007
Sold by
Young Charles S and Young Ina H
Bought by
Jones James F and Jones Ann Emory
Home Financials for this Owner
Home Financials are based on the most recent Mortgage that was taken out on this home.
Original Mortgage
$415,000
Interest Rate
6.37%
Mortgage Type
New Conventional
Purchase Details
Closed on
Aug 21, 2002
Bought by
Young Charles S Jr
Purchase Details
Closed on
Feb 10, 2000
Bought by
Young Charles S
Purchase Details
Closed on
Aug 11, 1999
Bought by
Lopez Homes Inc
Create a Home Valuation Report for This Property
The Home Valuation Report is an in-depth analysis detailing your home's value as well as a comparison with similar homes in the area
Home Values in the Area
Average Home Value in this Area
Purchase History
| Date | Buyer | Sale Price | Title Company |
|---|---|---|---|
| Cooning Michael J | -- | None Available | |
| Cooning Michael | $400,000 | None Available | |
| Jones James F | $539,500 | None Available | |
| Young Charles S Jr | $32,000 | -- | |
| Young Charles S | $407,400 | -- | |
| Lopez Homes Inc | $45,000 | -- | |
| Custom Development Properties Llc | $35,500 | -- |
Source: Public Records
Mortgage History
| Date | Status | Borrower | Loan Amount |
|---|---|---|---|
| Previous Owner | Jones James F | $415,000 |
Source: Public Records
Tax History Compared to Growth
Tax History
| Year | Tax Paid | Tax Assessment Tax Assessment Total Assessment is a certain percentage of the fair market value that is determined by local assessors to be the total taxable value of land and additions on the property. | Land | Improvement |
|---|---|---|---|---|
| 2025 | $5,008 | $804,676 | $78,837 | $725,839 |
| 2024 | $4,972 | $804,676 | $78,837 | $725,839 |
| 2023 | $4,967 | $804,676 | $78,837 | $725,839 |
| 2022 | $4,169 | $547,077 | $88,000 | $459,077 |
| 2021 | $4,131 | $547,077 | $88,000 | $459,077 |
| 2020 | $3,906 | $547,077 | $88,000 | $459,077 |
| 2019 | $3,906 | $547,077 | $88,000 | $459,077 |
| 2018 | $3,449 | $461,144 | $87,700 | $373,444 |
| 2017 | $3,348 | $461,144 | $87,700 | $373,444 |
| 2016 | $3,336 | $461,144 | $87,700 | $373,444 |
| 2015 | $3,503 | $461,144 | $87,700 | $373,444 |
| 2014 | $3,312 | $443,771 | $89,000 | $354,771 |
Source: Public Records
Map
Nearby Homes
- 1763 Mount Carmel Cir
- 1775 Mount Carmel Cir
- 1567 Withers Dr
- 1791 Withers Dr
- 1487 Winged Foot Dr
- 1486 Winged Foot Dr
- 000 Verdict Ridge Dr Unit 284
- 1063 Ventosa Dr
- 7245 Willow Brook Ct
- 2273 Pine Valley Dr
- 1515 Baltusrol Dr
- 1064 Ventosa Dr
- 7362 Hemlock Ct
- 2A Ventosa Dr
- 1365 Winged Foot Dr
- 1376 Winged Foot Dr
- 1037 Ventosa Dr
- 7246 Windy Ridge Dr
- Lot 1B Ventosa Dr
- 5170 Turtle Creek Dr
- 58 Mt Carmel Cir
- 1721 Verdict Ridge Dr
- 1756 Mount Carmel Cir
- #59 Mt Carmel Cir
- 49 Mt Carmel Cir
- 53 Mt Carmel Cir
- Lot 59 Mt Carmel Cir
- 59 Mt Carmel Cir Unit 59
- 1731 Mount Carmel Cir
- 1733 Verdict Ridge Dr
- 1720 Verdict Ridge Dr
- 1720 Verdict Ridge Dr Unit 28 & 29
- 1737 Mount Carmel Cir
- 0 Mt Carmel Cir Unit 61 3154794
- 1743 Verdict Ridge Dr
- 1743 Mount Carmel Cir
- 1702 Verdict Ridge Dr Unit 31
- 1708 Verdict Ridge Dr
- 1696 Verdict Ridge Dr
- 1696 Verdict Ridge Dr Unit 32