Estimated Value: $269,125 - $302,000
--
Bed
2
Baths
1,608
Sq Ft
$179/Sq Ft
Est. Value
About This Home
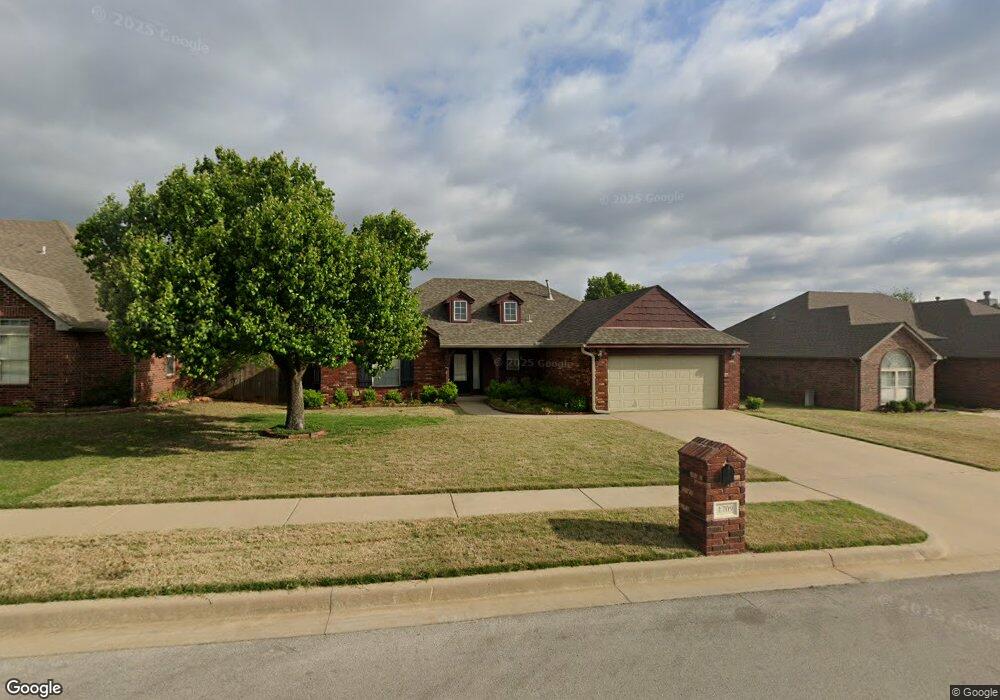
This home is located at 1709 W 117th Place S, Jenks, OK 74037 and is currently estimated at $287,281, approximately $178 per square foot. 1709 W 117th Place S is a home located in Tulsa County with nearby schools including Jenks West Elementary School, Jenks West Intermediate Elementary School, and Jenks Middle School.
Ownership History
Date
Name
Owned For
Owner Type
Purchase Details
Closed on
Oct 22, 2020
Sold by
Veldstra Tim and Veldstra Andrea
Bought by
Pau Pum Khan and Dim Vung Lian
Current Estimated Value
Home Financials for this Owner
Home Financials are based on the most recent Mortgage that was taken out on this home.
Original Mortgage
$190,950
Outstanding Balance
$169,530
Interest Rate
2.8%
Mortgage Type
New Conventional
Estimated Equity
$117,751
Purchase Details
Closed on
Sep 3, 2004
Sold by
Mckinney & Mckinney Inc
Bought by
Veldstra Tim and Veldstra Andrea
Home Financials for this Owner
Home Financials are based on the most recent Mortgage that was taken out on this home.
Original Mortgage
$109,900
Interest Rate
4.62%
Mortgage Type
Purchase Money Mortgage
Purchase Details
Closed on
Sep 26, 2003
Sold by
Churchill Park Development Llc
Bought by
Mckinney & Mckinney Inc
Create a Home Valuation Report for This Property
The Home Valuation Report is an in-depth analysis detailing your home's value as well as a comparison with similar homes in the area
Home Values in the Area
Average Home Value in this Area
Purchase History
| Date | Buyer | Sale Price | Title Company |
|---|---|---|---|
| Pau Pum Khan | $201,000 | Executive Title | |
| Veldstra Tim | $137,500 | Delta Title & Escrow Company | |
| Mckinney & Mckinney Inc | $71,000 | -- |
Source: Public Records
Mortgage History
| Date | Status | Borrower | Loan Amount |
|---|---|---|---|
| Open | Pau Pum Khan | $190,950 | |
| Previous Owner | Veldstra Tim | $109,900 |
Source: Public Records
Tax History Compared to Growth
Tax History
| Year | Tax Paid | Tax Assessment Tax Assessment Total Assessment is a certain percentage of the fair market value that is determined by local assessors to be the total taxable value of land and additions on the property. | Land | Improvement |
|---|---|---|---|---|
| 2024 | $2,772 | $22,456 | $3,304 | $19,152 |
| 2023 | $2,772 | $22,773 | $3,478 | $19,295 |
| 2022 | $2,714 | $21,110 | $3,728 | $17,382 |
| 2021 | $2,749 | $21,110 | $3,728 | $17,382 |
| 2020 | $2,044 | $16,053 | $3,676 | $12,377 |
| 2019 | $2,058 | $16,053 | $3,676 | $12,377 |
| 2018 | $2,068 | $16,023 | $3,669 | $12,354 |
| 2017 | $1,972 | $16,528 | $3,785 | $12,743 |
| 2016 | $1,958 | $16,047 | $3,675 | $12,372 |
| 2015 | $1,933 | $17,053 | $3,905 | $13,148 |
| 2014 | $1,915 | $15,125 | $3,905 | $11,220 |
Source: Public Records
Map
Nearby Homes
- 119 W 119th St
- 11527 S Nandina Place
- 12004 S Nandina Ave
- 1615 W 115th Place
- 1623 W 114th St
- 11515 S Mulberry Ct
- 12009 S Umber St
- 110 W 113th St S
- 12002 S Vine St
- 780 W 121st St S
- 11206 S Redbud St
- 11728 S Willow Place
- 11710 S Willow Place
- 11920 S Holley St
- 12108 S Elm St
- 11220 S Fir Ave
- 11212 S Fir Ave
- 2629 W 115th St S
- 11260 S Fir Ave
- 10906 S Mulberry Ave
- 1707 W 117th Place S
- 1711 W 117th Place S
- 1706 W 117th St S
- 1708 W 117th St S
- 1705 W 117th Place S
- 1710 W 117th St S
- 1708 W 117th Place S
- 1712 W 117th St S
- 1712 W 117th St S
- 1703 W 117th Place S
- 1706 W 117th Place S
- 1704 W 117th St S
- 1702 W 117th St S
- 11709 S Primrose St
- 1704 W 117th Place S
- 11618 S Primrose St W
- 11702 S Primrose St
- 1802 W 117th St S
- 1705 W 117th St S
- 1707 W 117th St S