Estimated Value: $294,000 - $312,000
3
Beds
2
Baths
1,820
Sq Ft
$166/Sq Ft
Est. Value
About This Home
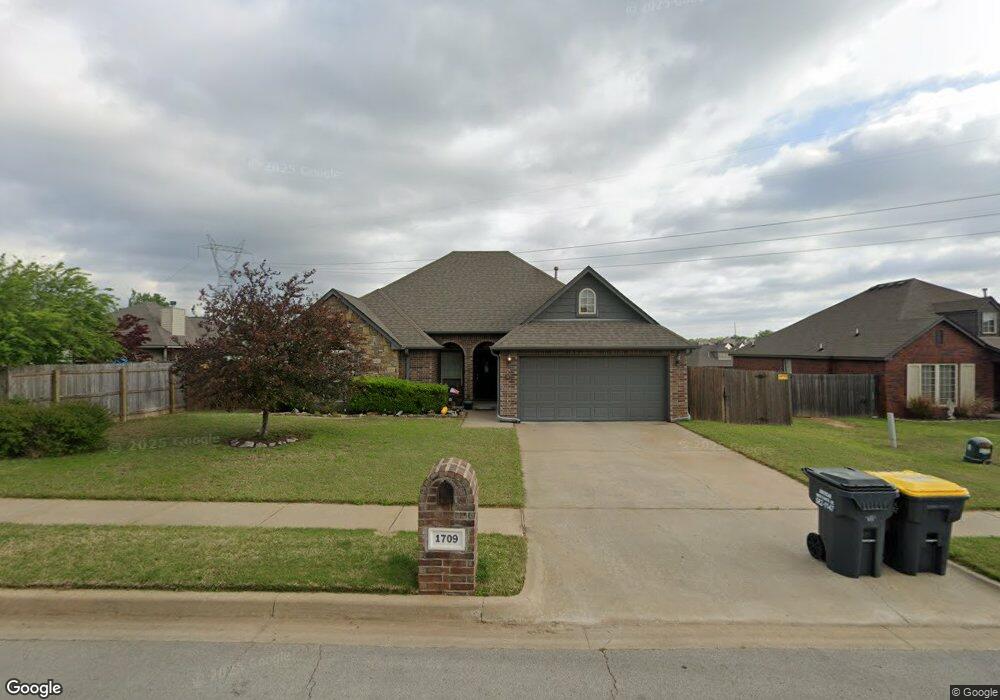
This home is located at 1709 W 118th St S, Jenks, OK 74037 and is currently estimated at $301,373, approximately $165 per square foot. 1709 W 118th St S is a home located in Tulsa County with nearby schools including Jenks West Elementary School, Jenks West Intermediate Elementary School, and Jenks Middle School.
Ownership History
Date
Name
Owned For
Owner Type
Purchase Details
Closed on
Oct 14, 2008
Sold by
Prudential Relocation Inc
Bought by
Holler Heather L
Current Estimated Value
Home Financials for this Owner
Home Financials are based on the most recent Mortgage that was taken out on this home.
Original Mortgage
$150,000
Interest Rate
6.48%
Mortgage Type
New Conventional
Purchase Details
Closed on
Sep 8, 2005
Sold by
Batey Llc
Bought by
Rollins Lance D and Rollins Kellie A
Home Financials for this Owner
Home Financials are based on the most recent Mortgage that was taken out on this home.
Original Mortgage
$131,920
Interest Rate
5.75%
Mortgage Type
Fannie Mae Freddie Mac
Purchase Details
Closed on
Aug 13, 2004
Sold by
Crosby Paul L and Crosby Elane
Bought by
Batey Llc
Home Financials for this Owner
Home Financials are based on the most recent Mortgage that was taken out on this home.
Original Mortgage
$31,107
Interest Rate
6.18%
Mortgage Type
Purchase Money Mortgage
Create a Home Valuation Report for This Property
The Home Valuation Report is an in-depth analysis detailing your home's value as well as a comparison with similar homes in the area
Home Values in the Area
Average Home Value in this Area
Purchase History
| Date | Buyer | Sale Price | Title Company |
|---|---|---|---|
| Holler Heather L | $164,500 | Residential Title & Escrow | |
| Rollins Lance D | $165,000 | First American Title & Abstr | |
| Batey Llc | $38,500 | Tulsa Abstract & Title Co |
Source: Public Records
Mortgage History
| Date | Status | Borrower | Loan Amount |
|---|---|---|---|
| Previous Owner | Holler Heather L | $150,000 | |
| Previous Owner | Rollins Lance D | $131,920 | |
| Previous Owner | Batey Llc | $31,107 |
Source: Public Records
Tax History Compared to Growth
Tax History
| Year | Tax Paid | Tax Assessment Tax Assessment Total Assessment is a certain percentage of the fair market value that is determined by local assessors to be the total taxable value of land and additions on the property. | Land | Improvement |
|---|---|---|---|---|
| 2024 | $2,312 | $18,737 | $2,878 | $15,859 |
| 2023 | $2,312 | $19,161 | $3,068 | $16,093 |
| 2022 | $2,263 | $17,604 | $4,128 | $13,476 |
| 2021 | $2,222 | $17,062 | $4,001 | $13,061 |
| 2020 | $2,173 | $17,062 | $4,001 | $13,061 |
| 2019 | $2,188 | $17,062 | $4,001 | $13,061 |
| 2018 | $2,203 | $17,062 | $4,001 | $13,061 |
| 2017 | $2,166 | $18,062 | $4,235 | $13,827 |
| 2016 | $2,227 | $18,119 | $4,235 | $13,884 |
| 2015 | $2,338 | $18,835 | $4,235 | $14,600 |
| 2014 | $2,318 | $18,095 | $4,235 | $13,860 |
Source: Public Records
Map
Nearby Homes
- 119 W 119th St
- 12009 S Umber St
- 12004 S Nandina Ave
- 11527 S Nandina Place
- 780 W 121st St S
- 12002 S Vine St
- 1615 W 115th Place
- 11515 S Mulberry Ct
- 1623 W 114th St
- 11728 S Willow Place
- 11710 S Willow Place
- 110 W 113th St S
- 11920 S Holley St
- 11206 S Redbud St
- 12108 S Elm St
- 11220 S Fir Ave
- 11212 S Fir Ave
- 626 W 120th St S
- 2629 W 115th St S
- 11260 S Fir Ave
- 11713 S Primrose St
- 11711 S Primrose St
- 1707 W 118th St S
- 1708 W 118th St S
- 1710 W 118th St S
- 1706 W 118th St S
- 1712 W 118th St S
- 11709 S Primrose St
- 1704 W 118th St S
- 11712 S Primrose St
- 11708 S Oak St
- 11710 S Primrose St
- 1713 W 119th St S
- 1717 W 119th St S
- 1708 W 117th Place S
- 11714 S Primrose St
- 1702 W 118th St S
- 11708 S Primrose St
- 1711 W 119th St S
- 1719 W 119th St S