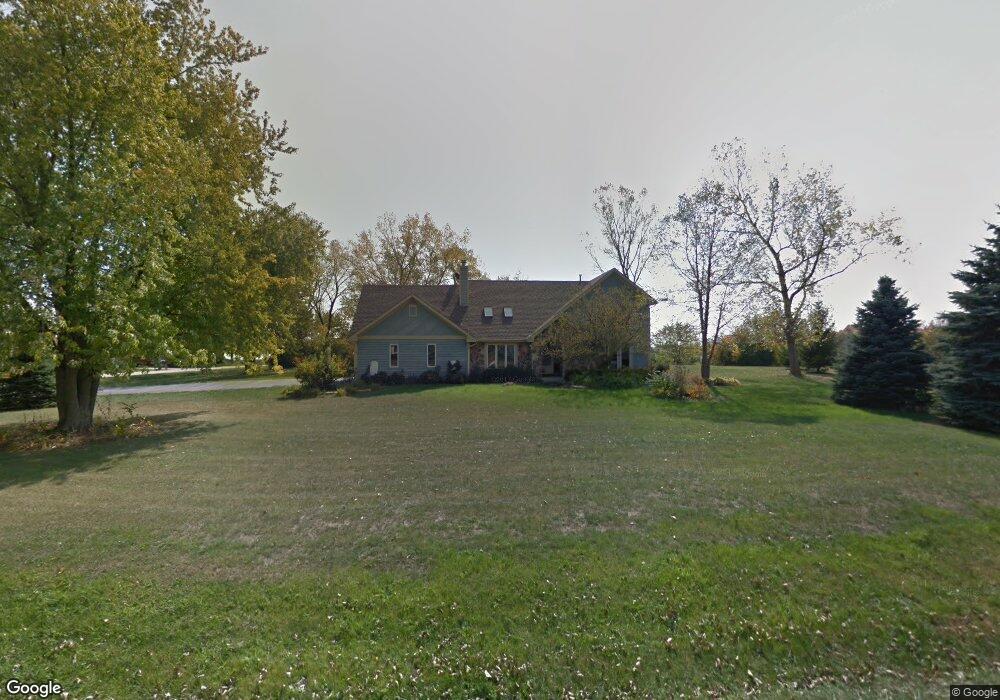
1709 W Hunters Ln Spring Grove, IL 60081
Estimated Value: $411,300 - $443,000
3
Beds
2
Baths
2,056
Sq Ft
$208/Sq Ft
Est. Value
About This Home
This home is located at 1709 W Hunters Ln, Spring Grove, IL 60081 and is currently estimated at $428,325, approximately $208 per square foot. 1709 W Hunters Ln is a home located in McHenry County with nearby schools including Richmond Grade School, Nippersink Middle School, and Richmond-Burton High School.
Ownership History
Date
Name
Owned For
Owner Type
Purchase Details
Closed on
Apr 28, 2003
Sold by
Prudential Residential Service
Bought by
Banaszynski Melissa A
Current Estimated Value
Home Financials for this Owner
Home Financials are based on the most recent Mortgage that was taken out on this home.
Original Mortgage
$190,000
Interest Rate
5.86%
Mortgage Type
Balloon
Purchase Details
Closed on
Apr 16, 2003
Sold by
Stewart Betty A and Rozanski Betty A
Bought by
Prudential Residential Service and Prudential Homes Corp
Home Financials for this Owner
Home Financials are based on the most recent Mortgage that was taken out on this home.
Original Mortgage
$190,000
Interest Rate
5.86%
Mortgage Type
Balloon
Purchase Details
Closed on
Aug 3, 1993
Sold by
Rozanski Steven M
Bought by
Rozanski Betty A
Create a Home Valuation Report for This Property
The Home Valuation Report is an in-depth analysis detailing your home's value as well as a comparison with similar homes in the area
Home Values in the Area
Average Home Value in this Area
Purchase History
| Date | Buyer | Sale Price | Title Company |
|---|---|---|---|
| Banaszynski Melissa A | $269,000 | Ticor | |
| Prudential Residential Service | $269,000 | Ticor | |
| Rozanski Betty A | -- | -- |
Source: Public Records
Mortgage History
| Date | Status | Borrower | Loan Amount |
|---|---|---|---|
| Closed | Banaszynski Melissa A | $190,000 |
Source: Public Records
Tax History Compared to Growth
Tax History
| Year | Tax Paid | Tax Assessment Tax Assessment Total Assessment is a certain percentage of the fair market value that is determined by local assessors to be the total taxable value of land and additions on the property. | Land | Improvement |
|---|---|---|---|---|
| 2024 | $8,326 | $118,860 | $21,072 | $97,788 |
| 2023 | $8,267 | $110,856 | $19,653 | $91,203 |
| 2022 | $7,793 | $97,516 | $17,288 | $80,228 |
| 2021 | $7,401 | $91,927 | $16,297 | $75,630 |
| 2020 | $7,056 | $85,876 | $15,579 | $70,297 |
| 2019 | $7,100 | $84,541 | $15,337 | $69,204 |
| 2018 | $7,242 | $81,928 | $14,863 | $67,065 |
| 2017 | $7,135 | $76,935 | $13,957 | $62,978 |
| 2016 | $7,159 | $73,474 | $13,329 | $60,145 |
| 2013 | -- | $72,225 | $13,611 | $58,614 |
Source: Public Records
Map
Nearby Homes
- 9623 N Hunters Ln
- 9817 N Hunters Ln
- 2102 W Hunters Ln
- Sausalito - Two-story Plan at Thousand Oaks
- Monterey - Two-story Plan at Thousand Oaks
- Glendale - Two-story Plan at Thousand Oaks
- Carmel - Two-story Plan at Thousand Oaks
- Catalina - Two-story Plan at Thousand Oaks
- Dawson - Two-story Plan at Thousand Oaks
- Sonoma - Ranch Plan at Thousand Oaks
- Coronado - Ranch Plan at Thousand Oaks
- Montana - Ranch Plan at Thousand Oaks
- Pasadena - Ranch Plan at Thousand Oaks
- Fontana - Ranch Plan at Thousand Oaks
- 9436 Bellaire Ln
- 2619 Sanctuary Ln
- 9033 Winn Rd
- 2647 Sanctuary Ln
- 2502 S Hidden Trail
- Sausalito - Two-story Plan at Vista Ridge
- 1717 W Hunters Ln
- 9604 Fox Trail Dr
- 9622 Fox Trail Dr
- 1716 W Hunters Ln
- 9628 N Hunters Ln
- 1805 W Hunters Ln
- 1802 W Hunters Ln
- 9703 N Hunters Ln
- 9704 N Hunters Ln
- 9583 Richardson Rd
- 9585 Richardson Rd
- 1811 W Hunters Ln Unit 2
- 9601 Richardson Rd
- 9709 N Hunters Ln
- 9710 N Hunters Ln
- 9617 Richardson Rd
- 9407 Richardson Rd
- 9708 Dale Ct
- 1819 W Hunters Ln
- 1816 W Hunters Ln