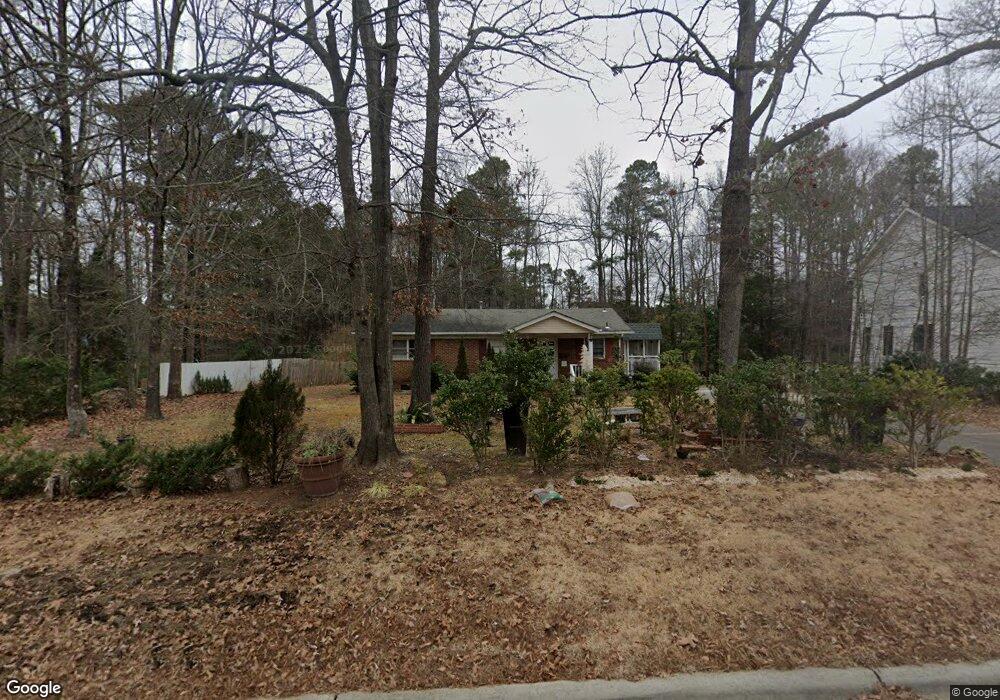
1709 Wynne Rd Durham, NC 27713
Estimated Value: $266,000 - $319,000
3
Beds
2
Baths
1,099
Sq Ft
$266/Sq Ft
Est. Value
About This Home
This home is located at 1709 Wynne Rd, Durham, NC 27713 and is currently estimated at $292,651, approximately $266 per square foot. 1709 Wynne Rd is a home located in Durham County with nearby schools including Fayetteville Street Elementary School, James E. Shepard Middle School, and Hillside High School.
Ownership History
Date
Name
Owned For
Owner Type
Purchase Details
Closed on
Aug 8, 2012
Sold by
Jackson John W
Bought by
Rojas Silvia and Vazquez Juan Jose
Current Estimated Value
Home Financials for this Owner
Home Financials are based on the most recent Mortgage that was taken out on this home.
Original Mortgage
$105,000
Interest Rate
3.68%
Mortgage Type
New Conventional
Purchase Details
Closed on
Aug 6, 2012
Sold by
Jackson John W
Bought by
Rojas Silvia and Vazquez Juan Jose
Home Financials for this Owner
Home Financials are based on the most recent Mortgage that was taken out on this home.
Original Mortgage
$105,000
Interest Rate
3.68%
Mortgage Type
New Conventional
Purchase Details
Closed on
Jul 2, 2007
Sold by
Miller Ronald T and Miller Delores Smith
Bought by
Jackson John
Create a Home Valuation Report for This Property
The Home Valuation Report is an in-depth analysis detailing your home's value as well as a comparison with similar homes in the area
Home Values in the Area
Average Home Value in this Area
Purchase History
| Date | Buyer | Sale Price | Title Company |
|---|---|---|---|
| Rojas Silvia | -- | None Available | |
| Rojas Silvia | -- | None Available | |
| Jackson John | $44,438 | None Available |
Source: Public Records
Mortgage History
| Date | Status | Borrower | Loan Amount |
|---|---|---|---|
| Closed | Rojas Silvia | $105,000 | |
| Closed | Rojas Silvia | $105,000 |
Source: Public Records
Tax History Compared to Growth
Tax History
| Year | Tax Paid | Tax Assessment Tax Assessment Total Assessment is a certain percentage of the fair market value that is determined by local assessors to be the total taxable value of land and additions on the property. | Land | Improvement |
|---|---|---|---|---|
| 2025 | $2,289 | $288,597 | $133,000 | $155,597 |
| 2024 | $1,175 | $140,390 | $28,040 | $112,350 |
| 2023 | $1,839 | $140,390 | $28,040 | $112,350 |
| 2022 | $1,797 | $140,390 | $28,040 | $112,350 |
| 2021 | $1,788 | $140,390 | $28,040 | $112,350 |
| 2020 | $1,746 | $140,390 | $28,040 | $112,350 |
| 2019 | $1,746 | $140,390 | $28,040 | $112,350 |
| 2018 | $1,603 | $118,167 | $28,040 | $90,127 |
| 2017 | $1,591 | $118,167 | $28,040 | $90,127 |
| 2016 | $1,537 | $118,167 | $28,040 | $90,127 |
| 2015 | $1,353 | $97,756 | $25,158 | $72,598 |
| 2014 | $1,353 | $97,756 | $25,158 | $72,598 |
Source: Public Records
Map
Nearby Homes
- 3027 Courtney Creek Blvd
- 3005 Courtney Creek Blvd
- 1633 Snow Mass Way
- 2638 S Alston Ave
- 2713 Wyntercrest Ln
- 703 Tambor Rd
- 700 Tambor Rd
- Cadence Plan at Courtney Creek
- Ballad Plan at Courtney Creek
- Aria Plan at Courtney Creek
- 1218 Helms St
- 1222 Helms St
- 714 Tambor Rd
- 1226 Helms St
- 705 Tambor Rd
- 1674 Snowmass Way
- 713 Tambor Rd
- 707 Tambor Rd
- 130 Holly Berry Ln
- 2810 Wyntercrest Ln