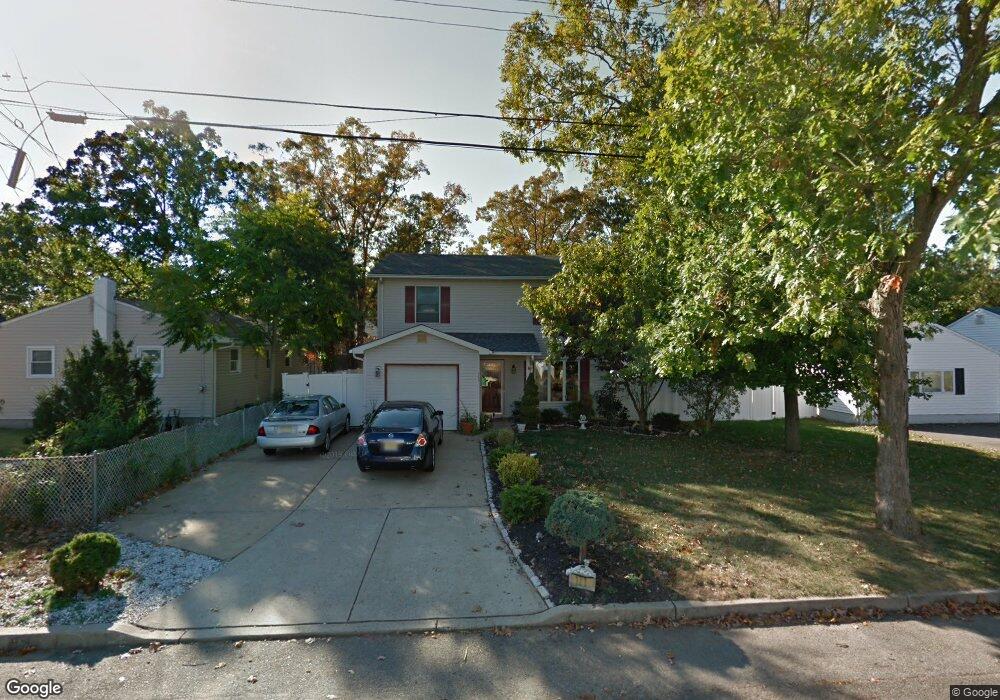
171 Austin Ave Old Bridge, NJ 08857
Estimated Value: $582,000 - $648,000
4
Beds
2
Baths
1,668
Sq Ft
$365/Sq Ft
Est. Value
About This Home
This home is located at 171 Austin Ave, Old Bridge, NJ 08857 and is currently estimated at $608,859, approximately $365 per square foot. 171 Austin Ave is a home located in Middlesex County with nearby schools including Old Bridge High School and St. Thomas the Apostle School.
Ownership History
Date
Name
Owned For
Owner Type
Purchase Details
Closed on
Aug 31, 2020
Sold by
Pagnotta John and Pagnotta Mary T
Bought by
Beshara Ibraam and Beshara Zuleicka
Current Estimated Value
Home Financials for this Owner
Home Financials are based on the most recent Mortgage that was taken out on this home.
Original Mortgage
$402,573
Outstanding Balance
$356,445
Interest Rate
2.9%
Mortgage Type
FHA
Estimated Equity
$252,414
Purchase Details
Closed on
May 11, 1992
Bought by
Pagnotta John and Pagnotta Mary
Create a Home Valuation Report for This Property
The Home Valuation Report is an in-depth analysis detailing your home's value as well as a comparison with similar homes in the area
Home Values in the Area
Average Home Value in this Area
Purchase History
| Date | Buyer | Sale Price | Title Company |
|---|---|---|---|
| Beshara Ibraam | $410,000 | Foundation Title Llc | |
| Beshara Ibraam | $410,000 | Foundation Title | |
| Pagnotta John | $140,000 | -- |
Source: Public Records
Mortgage History
| Date | Status | Borrower | Loan Amount |
|---|---|---|---|
| Open | Beshara Ibraam | $402,573 | |
| Closed | Beshara Ibraam | $402,573 |
Source: Public Records
Tax History Compared to Growth
Tax History
| Year | Tax Paid | Tax Assessment Tax Assessment Total Assessment is a certain percentage of the fair market value that is determined by local assessors to be the total taxable value of land and additions on the property. | Land | Improvement |
|---|---|---|---|---|
| 2025 | $7,815 | $138,400 | $44,000 | $94,400 |
| 2024 | $7,497 | $138,400 | $44,000 | $94,400 |
| 2023 | $7,497 | $138,400 | $44,000 | $94,400 |
| 2022 | $7,326 | $138,400 | $44,000 | $94,400 |
| 2021 | $5,377 | $138,400 | $44,000 | $94,400 |
| 2020 | $7,110 | $138,400 | $44,000 | $94,400 |
| 2019 | $6,989 | $138,400 | $44,000 | $94,400 |
| 2018 | $6,912 | $138,400 | $44,000 | $94,400 |
| 2017 | $6,687 | $138,400 | $44,000 | $94,400 |
| 2016 | $6,549 | $138,400 | $44,000 | $94,400 |
| 2015 | $6,436 | $138,400 | $44,000 | $94,400 |
| 2014 | $6,371 | $138,400 | $44,000 | $94,400 |
Source: Public Records
Map
Nearby Homes