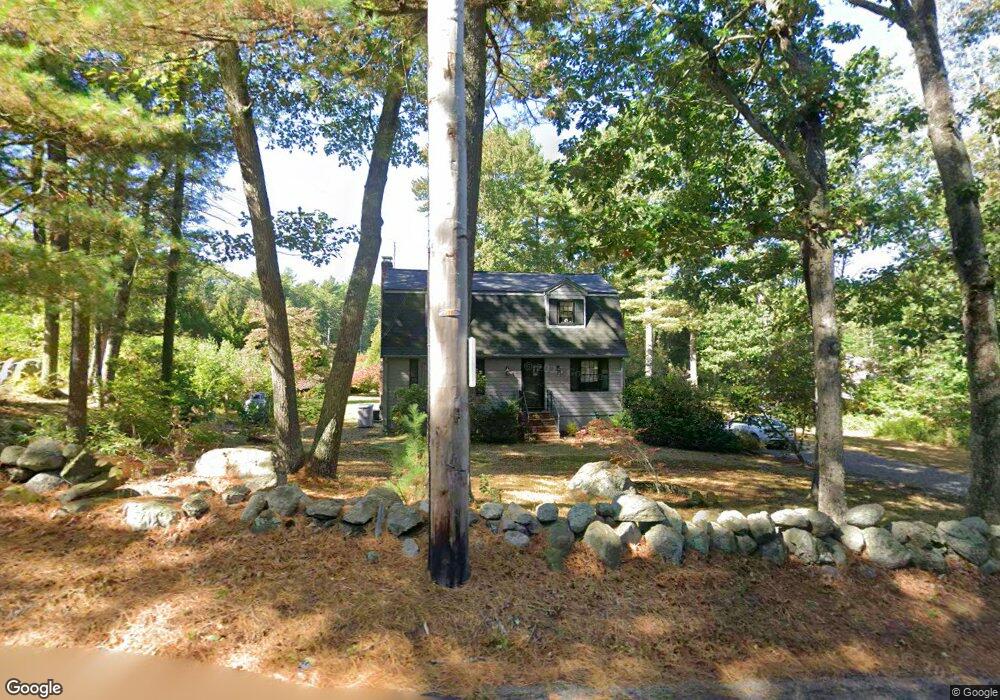
171 Chestnut St Wrentham, MA 02093
Sheldonville NeighborhoodEstimated Value: $583,000 - $720,000
4
Beds
2
Baths
1,632
Sq Ft
$406/Sq Ft
Est. Value
About This Home
This home is located at 171 Chestnut St, Wrentham, MA 02093 and is currently estimated at $662,518, approximately $405 per square foot. 171 Chestnut St is a home located in Norfolk County with nearby schools including Delaney Elementary School, Charles E Roderick, and Mercymount Country Day School.
Ownership History
Date
Name
Owned For
Owner Type
Purchase Details
Closed on
Oct 25, 1993
Sold by
Neske Bruce A and Neske Suzanne E
Bought by
Fay John J and Fay Kathleen
Current Estimated Value
Home Financials for this Owner
Home Financials are based on the most recent Mortgage that was taken out on this home.
Original Mortgage
$142,892
Interest Rate
6.73%
Mortgage Type
Purchase Money Mortgage
Create a Home Valuation Report for This Property
The Home Valuation Report is an in-depth analysis detailing your home's value as well as a comparison with similar homes in the area
Home Values in the Area
Average Home Value in this Area
Purchase History
| Date | Buyer | Sale Price | Title Company |
|---|---|---|---|
| Fay John J | $154,900 | -- |
Source: Public Records
Mortgage History
| Date | Status | Borrower | Loan Amount |
|---|---|---|---|
| Open | Fay John J | $92,000 | |
| Closed | Fay John J | $142,892 | |
| Previous Owner | Fay John J | $124,000 |
Source: Public Records
Tax History
| Year | Tax Paid | Tax Assessment Tax Assessment Total Assessment is a certain percentage of the fair market value that is determined by local assessors to be the total taxable value of land and additions on the property. | Land | Improvement |
|---|---|---|---|---|
| 2025 | $6,658 | $574,500 | $322,900 | $251,600 |
| 2024 | $6,474 | $539,500 | $322,900 | $216,600 |
| 2023 | $6,305 | $499,600 | $293,700 | $205,900 |
| 2022 | $5,620 | $411,100 | $234,000 | $177,100 |
| 2021 | $5,183 | $368,400 | $198,300 | $170,100 |
| 2020 | $4,919 | $345,200 | $164,200 | $181,000 |
| 2019 | $5,131 | $363,400 | $182,400 | $181,000 |
| 2018 | $5,011 | $351,900 | $182,200 | $169,700 |
| 2017 | $4,718 | $331,100 | $178,700 | $152,400 |
| 2016 | $4,525 | $316,900 | $173,500 | $143,400 |
| 2015 | $4,407 | $294,200 | $166,800 | $127,400 |
| 2014 | $4,284 | $279,800 | $160,400 | $119,400 |
Source: Public Records
Map
Nearby Homes
- 440 Chestnut St
- 613 West St
- 955 Summer St
- 20 Field Cir
- 1222 South St
- 19 Chestnut Lot 0
- 11 Amber Dr
- 0 Fall Ln
- Lot 1 - Blueberry 2 Car Plan at King Philip Estates
- Lot 8 - Blueberry 2 Car Plan at King Philip Estates
- Lot 5 - Hughes 2 car Plan at King Philip Estates
- Lot 6 - Blueberry 3 Car Plan at King Philip Estates
- 10 Earle Stewart Ln Unit Lot 5
- Lot 2 - Camden 2 Car Plan at King Philip Estates
- Lot 7 - Cedar Plan at King Philip Estates
- Lot 4 - Hemingway 2 Car Plan at King Philip Estates
- Lot 3 - Blueberry 2 Car Plan at King Philip Estates
- 12 Earle Stewart Ln
- 11 Earle Stewart Ln
- 18 Huntington Ave
- 176 Chestnut St
- 181 Chestnut St
- 145 Chestnut St
- 185 Chestnut St
- 183 Chestnut St
- 182 Chestnut St
- 105 Chestnut St
- 211 Chestnut St
- 125 Chestnut St
- 10 Acorn Rd
- 85 Chestnut St
- 25 Acorn Rd
- 32 Acorn Rd
- 221 Chestnut St
- 100 Chestnut St
- 95 Carriage House Ln
- 200 Chestnut St
- 35 Acorn Rd
- 42 Acorn Rd
- 75 Chestnut St
Your Personal Tour Guide
Ask me questions while you tour the home.