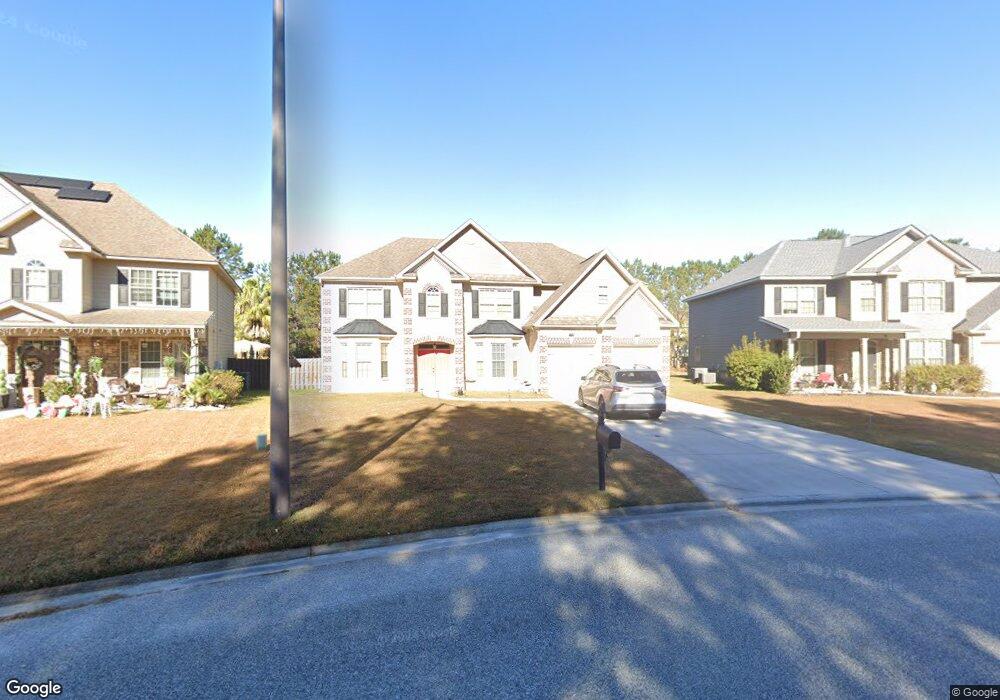
171 Clover Point Cir Unit 148 Guyton, GA 31312
Estimated Value: $484,140 - $525,000
5
Beds
4
Baths
4,174
Sq Ft
$121/Sq Ft
Est. Value
About This Home
This home is located at 171 Clover Point Cir Unit 148, Guyton, GA 31312 and is currently estimated at $503,535, approximately $120 per square foot. 171 Clover Point Cir Unit 148 is a home located in Effingham County with nearby schools including South Effingham Elementary School, South Effingham Middle School, and South Effingham High School.
Ownership History
Date
Name
Owned For
Owner Type
Purchase Details
Closed on
Nov 6, 2020
Sold by
Soriano Dino
Bought by
Patel Jignesh Kumar and Patel Nisha
Current Estimated Value
Home Financials for this Owner
Home Financials are based on the most recent Mortgage that was taken out on this home.
Original Mortgage
$250,000
Outstanding Balance
$219,989
Interest Rate
2.8%
Mortgage Type
New Conventional
Estimated Equity
$283,546
Purchase Details
Closed on
Apr 5, 2012
Sold by
Faircloth Homes Of Savanna
Bought by
Soriano Dino
Purchase Details
Closed on
Jan 29, 2012
Sold by
Clover Pointe Development Llc
Bought by
Faircloth Homes Of Savannah Llc
Purchase Details
Closed on
Feb 22, 2011
Sold by
Ernest Communities Llc
Bought by
Clover Pointe Development Llc
Purchase Details
Closed on
Mar 27, 2007
Bought by
Ernest Communities Llc
Create a Home Valuation Report for This Property
The Home Valuation Report is an in-depth analysis detailing your home's value as well as a comparison with similar homes in the area
Home Values in the Area
Average Home Value in this Area
Purchase History
| Date | Buyer | Sale Price | Title Company |
|---|---|---|---|
| Patel Jignesh Kumar | $312,500 | -- | |
| Soriano Dino | $268,000 | -- | |
| Faircloth Homes Of Savannah Llc | $38,000 | -- | |
| Clover Pointe Development Llc | $3,340,900 | -- | |
| Ernest Communities Llc | -- | -- |
Source: Public Records
Mortgage History
| Date | Status | Borrower | Loan Amount |
|---|---|---|---|
| Open | Patel Jignesh Kumar | $250,000 |
Source: Public Records
Tax History
| Year | Tax Paid | Tax Assessment Tax Assessment Total Assessment is a certain percentage of the fair market value that is determined by local assessors to be the total taxable value of land and additions on the property. | Land | Improvement |
|---|---|---|---|---|
| 2025 | $6,169 | $187,136 | $22,800 | $164,336 |
| 2024 | $6,169 | $197,086 | $22,800 | $174,286 |
| 2023 | $4,964 | $171,272 | $18,800 | $152,472 |
| 2022 | $4,307 | $137,741 | $18,000 | $119,741 |
| 2021 | $3,969 | $131,187 | $17,000 | $114,187 |
| 2020 | $3,485 | $124,786 | $17,000 | $107,786 |
| 2019 | $3,507 | $124,786 | $17,000 | $107,786 |
| 2018 | $3,494 | $122,204 | $16,000 | $106,204 |
| 2017 | $3,343 | $114,988 | $16,000 | $98,988 |
| 2016 | $3,187 | $110,298 | $16,000 | $94,298 |
| 2015 | -- | $109,498 | $15,200 | $94,298 |
| 2014 | -- | $109,498 | $15,200 | $94,298 |
| 2013 | -- | $114,798 | $15,200 | $99,598 |
Source: Public Records
Map
Nearby Homes
- 108 Broken Bit Cir
- 118 Red Maple Ln
- 143 Clover Point Cir
- 127 Red Maple Ln
- 116 Bluegrass Cir
- 243 Saddleclub Way
- 0 Hodgeville Rd Unit SA341541
- 0 Hodgeville Rd Unit 10622997
- 191 Saddleclub Way
- 105 Liam Ct
- 203 Alyssa Ave
- 215 Haisley Run
- 219 Haisley Run
- 220 Haisley Run
- 239 Haisley Run
- 238 Haisley Run
- 241 Haisley Run
- 240 Haisley Run
- 243 Haisley Run
- 242 Haisley Run
- 171 Clover Point Cir
- 173 Clover Point Cir
- 200 Cypress Creek Ln
- 175 Clover Point Cir
- 202 Cypress Creek Ln
- 204 Cypress Creek Ln
- 125 Saddleclub Way
- 177 Clover Point Cir
- 201 Cypress Creek Ln
- 123 Saddleclub Way
- 127 Saddleclub Way
- 206 Cypress Creek Ln
- 203 Cypress Creek Ln
- 121 Saddleclub Way
- 144 Clover Point Cir Unit 176
- 144 Clover Point Cir
- 129 Saddleclub Way
- 205 Cypress Creek Ln
- 179 Clover Point Cir
- 208 Cypress Creek Ln
Your Personal Tour Guide
Ask me questions while you tour the home.