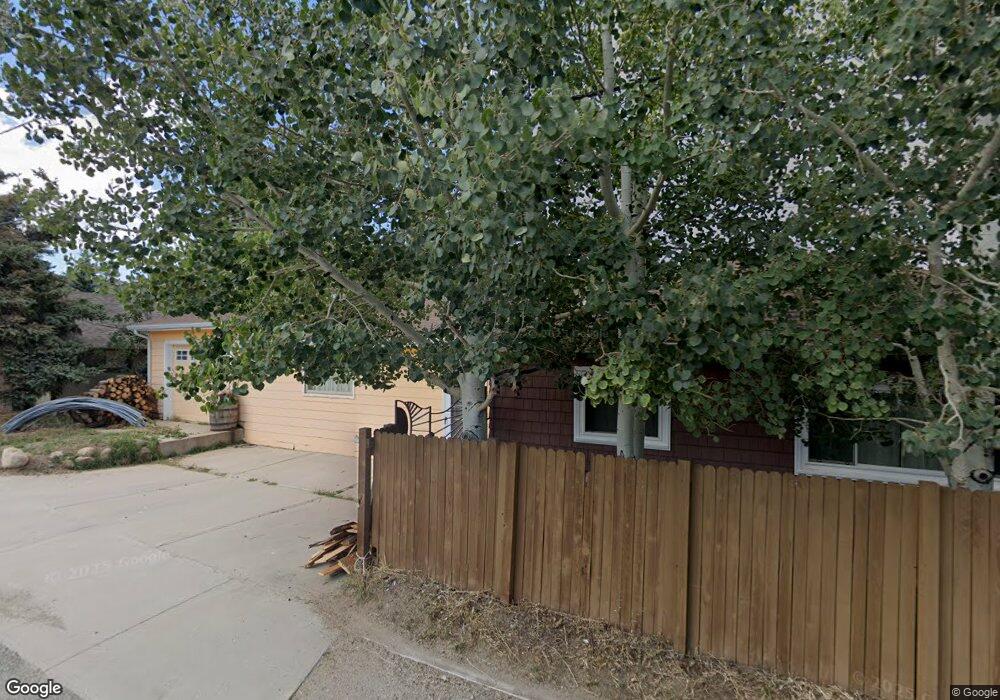
171 E 2nd St Nederland, CO 80466
Estimated Value: $621,000 - $648,000
2
Beds
1
Bath
1,280
Sq Ft
$498/Sq Ft
Est. Value
About This Home
This home is located at 171 E 2nd St, Nederland, CO 80466 and is currently estimated at $637,040, approximately $497 per square foot. 171 E 2nd St is a home located in Boulder County with nearby schools including Nederland Elementary School and Nederland Middle-Senior High School.
Ownership History
Date
Name
Owned For
Owner Type
Purchase Details
Closed on
Nov 13, 2017
Sold by
Pcf92 Invemsntes Proepties Llc
Bought by
The Slack Family Revocable Trust
Current Estimated Value
Purchase Details
Closed on
Apr 5, 2016
Sold by
Farrell Paula
Bought by
Pcf92 Investment Properties Llc
Purchase Details
Closed on
Oct 23, 2015
Sold by
Thomas Susane R
Bought by
Farrell Paula
Purchase Details
Closed on
Feb 10, 2006
Sold by
Lund Linda I
Bought by
Thomas Susane R
Home Financials for this Owner
Home Financials are based on the most recent Mortgage that was taken out on this home.
Original Mortgage
$217,600
Interest Rate
5.5%
Mortgage Type
Fannie Mae Freddie Mac
Purchase Details
Closed on
Nov 30, 1993
Sold by
Tucker Anna Mae
Bought by
Hurst Norma S
Home Financials for this Owner
Home Financials are based on the most recent Mortgage that was taken out on this home.
Original Mortgage
$55,150
Interest Rate
6.71%
Create a Home Valuation Report for This Property
The Home Valuation Report is an in-depth analysis detailing your home's value as well as a comparison with similar homes in the area
Home Values in the Area
Average Home Value in this Area
Purchase History
| Date | Buyer | Sale Price | Title Company |
|---|---|---|---|
| The Slack Family Revocable Trust | $415,000 | Land Title Guarantee Co | |
| Pcf92 Investment Properties Llc | -- | None Available | |
| Farrell Paula | $337,500 | Land Title Guarantee Company | |
| Thomas Susane R | $272,000 | None Available | |
| Hurst Norma S | $78,800 | -- |
Source: Public Records
Mortgage History
| Date | Status | Borrower | Loan Amount |
|---|---|---|---|
| Previous Owner | Thomas Susane R | $217,600 | |
| Previous Owner | Hurst Norma S | $55,150 |
Source: Public Records
Tax History
| Year | Tax Paid | Tax Assessment Tax Assessment Total Assessment is a certain percentage of the fair market value that is determined by local assessors to be the total taxable value of land and additions on the property. | Land | Improvement |
|---|---|---|---|---|
| 2025 | $4,356 | $38,288 | $4,469 | $33,819 |
| 2024 | $4,356 | $38,288 | $4,469 | $33,819 |
| 2023 | $4,241 | $37,929 | $4,703 | $36,910 |
| 2022 | $3,912 | $33,450 | $4,226 | $29,224 |
| 2021 | $3,857 | $34,412 | $4,347 | $30,065 |
| 2020 | $3,613 | $31,897 | $4,505 | $27,392 |
| 2019 | $3,569 | $31,897 | $4,505 | $27,392 |
| 2018 | $3,070 | $27,137 | $6,984 | $20,153 |
| 2017 | $3,007 | $30,001 | $7,721 | $22,280 |
| 2016 | $2,007 | $17,655 | $6,686 | $10,969 |
| 2015 | $1,924 | $16,366 | $4,776 | $11,590 |
| 2014 | $1,859 | $16,366 | $4,776 | $11,590 |
Source: Public Records
Map
Nearby Homes
- 147 E 1st St
- 0 E 1st St Unit IRE1055555
- 365 N Bridge St
- 2 King Place
- 0 Peak To Peak Hwy Unit IRE1053429
- 0 Peak To Peak Hwy Unit REC2002177
- 0 Peak To Peak Hwy Unit 1040129
- 470 W 3rd St
- 470 W Spring St
- 602 W 3rd St
- 609 W 4th St
- 71 Pinecliff Trail
- 14 Sundown Trail
- 46 Pinecliff Trail
- 103 Wildewood Dr
- 45 Alpine Dr
- 8 Valley View Dr
- 5260 Ridge Rd
- 2315 Ridge Rd
- 710 Mcmillen Way
Your Personal Tour Guide
Ask me questions while you tour the home.