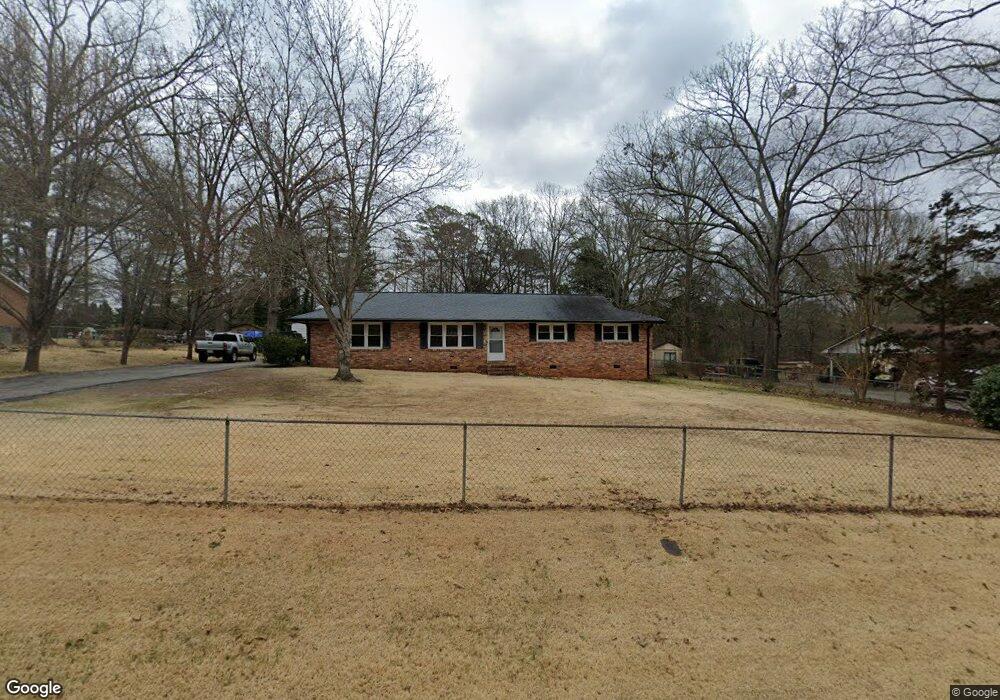
171 Fitzgerald Rd Spartanburg, SC 29307
Estimated Value: $211,000 - $257,000
3
Beds
2
Baths
1,792
Sq Ft
$128/Sq Ft
Est. Value
About This Home
This home is located at 171 Fitzgerald Rd, Spartanburg, SC 29307 and is currently estimated at $229,187, approximately $127 per square foot. 171 Fitzgerald Rd is a home located in Spartanburg County with nearby schools including Broome High School, Spartanburg Day School, and Mountain View Christian Academy.
Ownership History
Date
Name
Owned For
Owner Type
Purchase Details
Closed on
Aug 13, 2018
Sold by
Swofford Johnny Earl and Swofford John Earl
Bought by
Resendiz Olivia and Resendiz Campanilla Daniel
Current Estimated Value
Home Financials for this Owner
Home Financials are based on the most recent Mortgage that was taken out on this home.
Original Mortgage
$101,750
Outstanding Balance
$88,366
Interest Rate
4.5%
Mortgage Type
FHA
Estimated Equity
$140,821
Purchase Details
Closed on
Jul 30, 2018
Sold by
Swofford Cash Judy Kay and Swofford Hudgins Martha Lou
Bought by
Swafford Johnny Earl and Swafford John Earl
Home Financials for this Owner
Home Financials are based on the most recent Mortgage that was taken out on this home.
Original Mortgage
$101,750
Outstanding Balance
$88,366
Interest Rate
4.5%
Mortgage Type
FHA
Estimated Equity
$140,821
Purchase Details
Closed on
Mar 7, 2017
Sold by
Parker Grady L
Bought by
Swofford Johnny Earl and However Subject
Create a Home Valuation Report for This Property
The Home Valuation Report is an in-depth analysis detailing your home's value as well as a comparison with similar homes in the area
Home Values in the Area
Average Home Value in this Area
Purchase History
| Date | Buyer | Sale Price | Title Company |
|---|---|---|---|
| Resendiz Olivia | $115,000 | None Available | |
| Swofford John Earl | -- | None Available | |
| Swafford Johnny Earl | -- | None Available | |
| Swofford Johnny Earl | -- | None Available |
Source: Public Records
Mortgage History
| Date | Status | Borrower | Loan Amount |
|---|---|---|---|
| Open | Swofford John Earl | $101,750 | |
| Closed | Resendiz Olivia | $101,750 | |
| Closed | Swafford Johnny Earl | $101,750 |
Source: Public Records
Tax History Compared to Growth
Tax History
| Year | Tax Paid | Tax Assessment Tax Assessment Total Assessment is a certain percentage of the fair market value that is determined by local assessors to be the total taxable value of land and additions on the property. | Land | Improvement |
|---|---|---|---|---|
| 2025 | $984 | $5,276 | $610 | $4,666 |
| 2024 | $984 | $5,276 | $610 | $4,666 |
| 2023 | $984 | $5,276 | $610 | $4,666 |
| 2022 | $880 | $4,588 | $600 | $3,988 |
| 2021 | $880 | $4,588 | $600 | $3,988 |
| 2020 | $864 | $4,588 | $600 | $3,988 |
| 2019 | $3,321 | $4,931 | $545 | $4,386 |
| 2018 | $540 | $4,931 | $545 | $4,386 |
| 2017 | $407 | $4,288 | $600 | $3,688 |
| 2016 | $407 | $4,288 | $600 | $3,688 |
| 2015 | $402 | $4,288 | $600 | $3,688 |
| 2014 | $397 | $4,288 | $600 | $3,688 |
Source: Public Records
Map
Nearby Homes
- 1926 Bud Arthur Bridge Rd
- 215 Penny Bennett Rd
- 230 Idlewood Cir
- 204 Bennett Dairy Rd
- 3091 E Main Street Extension
- 655 Idlewood Cir
- 3025 E Main Street Extension
- 0 Old Converse Rd
- 124 Childress Rd
- 389 Main St
- 271 Cherry Hill Rd
- Grand Bahama Plan at Ellison - 2-Story
- Sequoia Plan at Ellison - 2-Story
- Tupelo Plan at Ellison - 2-Story
- Aspen Plan at Ellison - 2-Story
- Spruce Plan at Ellison - 2-Story
- Cedar Plan at Ellison - 2-Story
- 112 Riverview Park
- 276 Saranac Dr
- 9015 Margot Place
- 181 Fitzgerald Rd
- 161 Fitzgerald Rd
- 151 Jessie Fisher Ln
- 191 Fitzgerald Rd
- 149 Fitzgerald Rd
- 150 Jessie Fisher Ln
- 160 Fitzgerald Rd
- 180 Fitzgerald Rd
- 150 Fitzgerald Rd
- 131 Fitzgerald Rd
- 140 Jessie Fisher Ln
- 200 Fitzgerald Rd
- 140 Fitzgerald Rd
- 201 Fitzgerald Rd
- 212 Fitzgerald Rd
- 121 Fitzgerald Rd
- 130 Fitzgerald Rd
- 911 Old Converse Rd
- 120 Fitzgerald Rd
- 941 Old Converse Rd