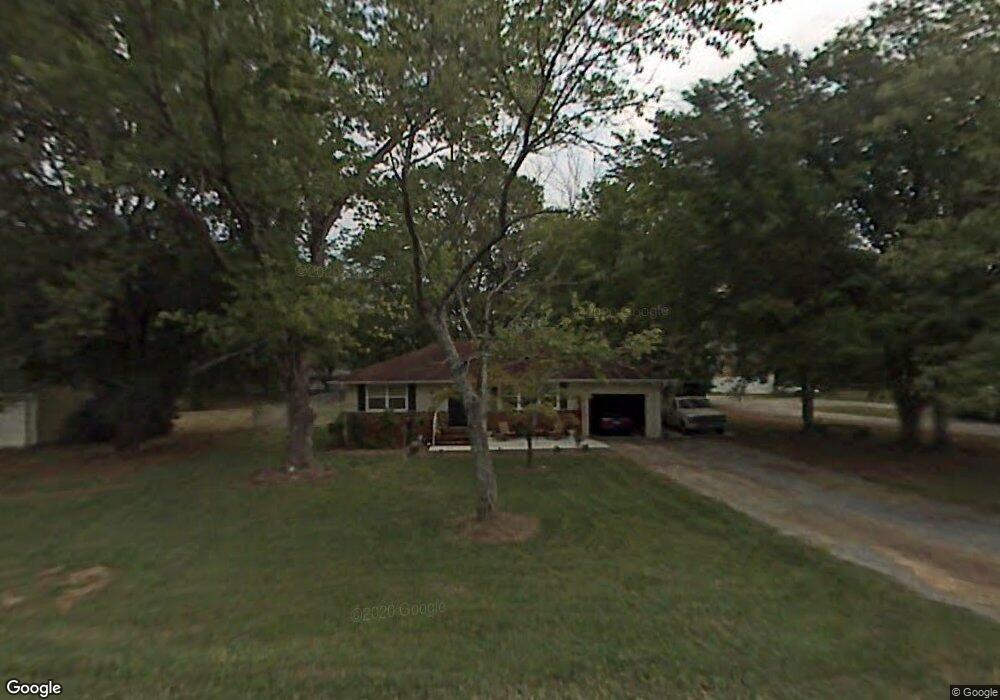
171 John Thompson Rd Flintstone, GA 30725
Flintstone NeighborhoodEstimated Value: $188,000 - $222,000
--
Bed
1
Bath
936
Sq Ft
$222/Sq Ft
Est. Value
About This Home
This home is located at 171 John Thompson Rd, Flintstone, GA 30725 and is currently estimated at $208,121, approximately $222 per square foot. 171 John Thompson Rd is a home located in Walker County with nearby schools including Chattanooga Valley Elementary School, Chattanooga Valley Middle School, and Ridgeland High School.
Ownership History
Date
Name
Owned For
Owner Type
Purchase Details
Closed on
Dec 30, 2024
Sold by
Harkleroad Daniel H
Bought by
Long Austin
Current Estimated Value
Home Financials for this Owner
Home Financials are based on the most recent Mortgage that was taken out on this home.
Original Mortgage
$201,286
Outstanding Balance
$201,115
Interest Rate
6.81%
Mortgage Type
New Conventional
Estimated Equity
$7,006
Purchase Details
Closed on
Jun 25, 2024
Sold by
North Annette H
Bought by
Harkleroad Daniel H and Harkleroad William D
Purchase Details
Closed on
Sep 1, 2004
Sold by
North North D and North Lanessa A
Bought by
North Annette H
Purchase Details
Closed on
May 9, 1995
Sold by
Denton Arthur Wayne
Bought by
North North D and North Lanessa A
Purchase Details
Closed on
Mar 28, 1994
Sold by
Denton Arthur Wayne
Bought by
Denton Arthur Wayne
Purchase Details
Closed on
Mar 17, 1981
Sold by
Denton Margaret E
Bought by
Denton Arthur Wayne
Purchase Details
Closed on
Apr 13, 1978
Sold by
Chapman David L
Bought by
Denton Margaret E
Purchase Details
Closed on
Jan 1, 1972
Bought by
Chapman David L
Create a Home Valuation Report for This Property
The Home Valuation Report is an in-depth analysis detailing your home's value as well as a comparison with similar homes in the area
Home Values in the Area
Average Home Value in this Area
Purchase History
| Date | Buyer | Sale Price | Title Company |
|---|---|---|---|
| Long Austin | $205,000 | -- | |
| Harkleroad Daniel H | $85,700 | -- | |
| North Annette H | -- | -- | |
| North North D | $35,000 | -- | |
| Denton Arthur Wayne | -- | -- | |
| Denton Arthur Wayne | $30,000 | -- | |
| Denton Margaret E | -- | -- | |
| Chapman David L | -- | -- |
Source: Public Records
Mortgage History
| Date | Status | Borrower | Loan Amount |
|---|---|---|---|
| Open | Long Austin | $201,286 | |
| Previous Owner | North Annette H | $135,000 |
Source: Public Records
Tax History Compared to Growth
Tax History
| Year | Tax Paid | Tax Assessment Tax Assessment Total Assessment is a certain percentage of the fair market value that is determined by local assessors to be the total taxable value of land and additions on the property. | Land | Improvement |
|---|---|---|---|---|
| 2024 | $1,123 | $48,823 | $4,054 | $44,769 |
| 2023 | $132 | $46,473 | $4,054 | $42,419 |
| 2022 | $95 | $40,401 | $4,054 | $36,347 |
| 2021 | $95 | $25,184 | $2,433 | $22,751 |
| 2020 | $95 | $21,063 | $2,433 | $18,630 |
| 2019 | $94 | $21,063 | $2,433 | $18,630 |
| 2018 | $557 | $21,063 | $2,433 | $18,630 |
| 2017 | $100 | $21,063 | $2,433 | $18,630 |
| 2016 | $131 | $21,063 | $2,433 | $18,630 |
| 2015 | $131 | $20,062 | $2,720 | $17,342 |
| 2014 | $66 | $20,062 | $2,720 | $17,342 |
| 2013 | -- | $20,062 | $2,720 | $17,342 |
Source: Public Records
Map
Nearby Homes
- 120 Williams Ave
- 304 John Thompson Rd
- 92 Nancy Ln
- 19 Turkey Run
- 14 Turkey Run
- 16 Japonica St
- 58 Japonica St
- 244 Haven Hill
- 309 W Schmitt Rd
- 4766 Happy Valley Rd
- 404 W Schmitt Rd
- 12 Mark Cir
- 4302 Happy Valley Rd
- 1136 Ridgeland Rd
- 54 Ferncliff Dr
- 242 Cascade Dr
- 757 W Schmitt Rd
- 52 Tower Dr
- 1308 Dry Valley Rd
- 184 Cinderella Dr
- 187 John Thompson Rd
- 16 Reed Ln
- 170 Reeds Ln
- 144 John Thompson Rd
- 170 Reed Ln
- 136 Reeds Ln
- 136 Reed Ln
- 219 John Thompson Rd
- 52 Reed Ln
- 52 Reeds Ln
- 184 John Thompson Rd
- 202 John Thompson Rd
- 95 John Thompson Rd
- 49 Williams Ave
- 104 Reed Ln
- 25 Williams Ave
- 218 John Thompson Rd
- 183 Reeds Ln
- 115 Williams Ave
- 183 Reed Ln