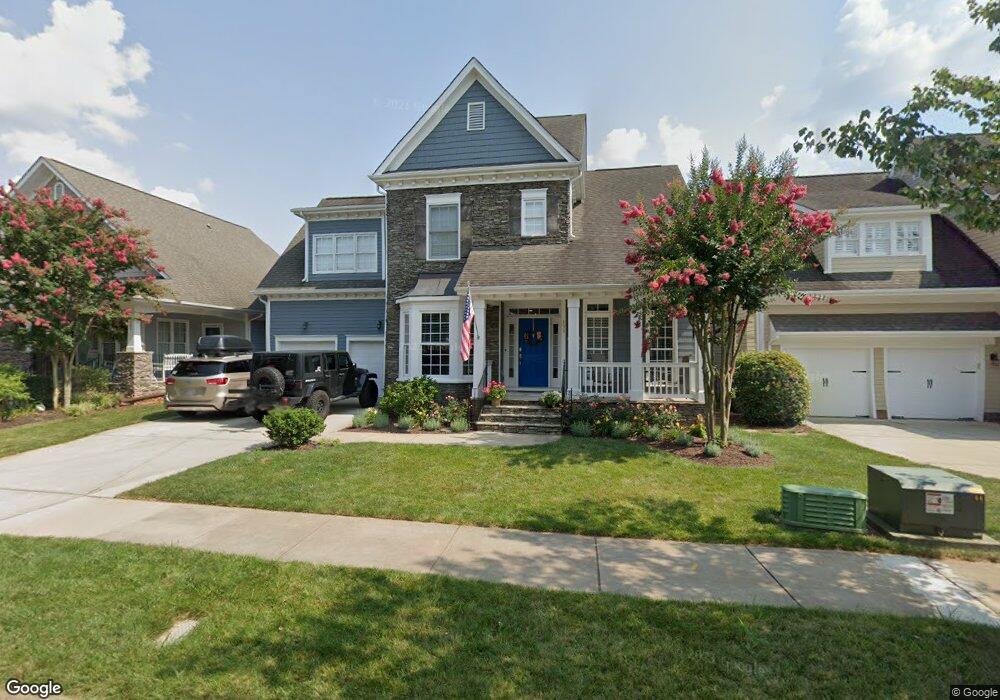
171 Lavender Bloom Loop Mooresville, NC 28115
Estimated Value: $851,000 - $1,003,000
4
Beds
4
Baths
3,232
Sq Ft
$277/Sq Ft
Est. Value
About This Home
This home is located at 171 Lavender Bloom Loop, Mooresville, NC 28115 and is currently estimated at $895,763, approximately $277 per square foot. 171 Lavender Bloom Loop is a home located in Iredell County with nearby schools including Coddle Creek Elementary School, Lake Norman High School, and Pine Lake Preparatory.
Ownership History
Date
Name
Owned For
Owner Type
Purchase Details
Closed on
Mar 25, 2021
Sold by
Hastings Scott Patrick and Hastings Stacey Michelle
Bought by
Mosher Peggy D and Peggy D Mosher Trust
Current Estimated Value
Home Financials for this Owner
Home Financials are based on the most recent Mortgage that was taken out on this home.
Original Mortgage
$500,000
Outstanding Balance
$446,408
Interest Rate
2.73%
Mortgage Type
New Conventional
Estimated Equity
$449,355
Purchase Details
Closed on
Jul 25, 2007
Sold by
Mid Atlantic Homes Llc
Bought by
Hastings Scott Patrick and Hastings Stacey Michelle
Home Financials for this Owner
Home Financials are based on the most recent Mortgage that was taken out on this home.
Original Mortgage
$463,307
Interest Rate
8.5%
Mortgage Type
Negative Amortization
Purchase Details
Closed on
Feb 9, 2007
Sold by
Jes Land Llc
Bought by
Arvida Mid Atlantic Homes Inc
Purchase Details
Closed on
Jun 15, 1993
Create a Home Valuation Report for This Property
The Home Valuation Report is an in-depth analysis detailing your home's value as well as a comparison with similar homes in the area
Home Values in the Area
Average Home Value in this Area
Purchase History
| Date | Buyer | Sale Price | Title Company |
|---|---|---|---|
| Mosher Peggy D | $625,000 | Chicago Title | |
| Hastings Scott Patrick | $488,000 | None Available | |
| Arvida Mid Atlantic Homes Inc | $394,500 | None Available | |
| -- | $150,000 | -- |
Source: Public Records
Mortgage History
| Date | Status | Borrower | Loan Amount |
|---|---|---|---|
| Open | Mosher Peggy D | $500,000 | |
| Closed | Mosher Peggy D | $500,000 | |
| Previous Owner | Hastings Scott Patrick | $463,307 |
Source: Public Records
Tax History
| Year | Tax Paid | Tax Assessment Tax Assessment Total Assessment is a certain percentage of the fair market value that is determined by local assessors to be the total taxable value of land and additions on the property. | Land | Improvement |
|---|---|---|---|---|
| 2025 | $5,089 | $656,490 | $150,000 | $506,490 |
| 2024 | $5,089 | $656,490 | $150,000 | $506,490 |
| 2023 | $5,089 | $656,490 | $150,000 | $506,490 |
| 2022 | $4,543 | $519,720 | $150,000 | $369,720 |
| 2021 | $4,490 | $511,590 | $150,000 | $361,590 |
| 2020 | $4,490 | $511,590 | $150,000 | $361,590 |
| 2019 | $4,439 | $511,590 | $150,000 | $361,590 |
| 2018 | $4,175 | $446,900 | $150,000 | $296,900 |
| 2017 | $4,175 | $446,900 | $150,000 | $296,900 |
| 2016 | $4,175 | $446,900 | $150,000 | $296,900 |
| 2015 | $4,175 | $446,900 | $150,000 | $296,900 |
| 2014 | $4,205 | $473,240 | $150,000 | $323,240 |
Source: Public Records
Map
Nearby Homes
- 183 Lavender Bloom Loop
- 159 Lavender Bloom Loop
- 283 Bridges Farm Rd
- 301 Bridges Farm Rd
- 191 Lilac Mist Loop
- 169 Alenda Lux Cir
- 167 Alenda Lux Cir
- 107 Clover Bank Rd
- 247 Alenda Lux Cir
- 245 Alenda Lux Cir
- 243 Alenda Lux Cir
- 235 Alenda Lux Cir
- 242 Alenda Lux Cir
- 240 Alenda Lux Cir
- 114 Alenda Lux Cir
- 546 Amalfi Dr
- 620 Amalfi Dr
- 744 Amalfi Dr
- 405 Armour St
- 438 Magnolia St
- 167 Lavender Bloom Loop
- 175 Lavender Bloom Loop
- 179 Lavender Bloom Loop
- 163 Lavender Bloom Loop
- 172 Lavender Bloom Loop
- 168 Lavender Bloom Loop
- 174 Lavender Bloom Loop
- 166 Lavender Bloom Loop
- 176 Lavender Bloom Loop
- 180 Lavender Bloom Loop
- 160 Lavender Bloom Loop
- 155 Lavender Bloom Loop
- 188 Lavender Bloom Loop
- 187 Lavender Bloom Loop
- 156 Lavender Bloom Loop
- 192 Lavender Bloom Loop
- 151 Lavender Bloom Loop
- 291 Bridges Farm Rd
- 289 Bridges Farm Rd
- 154 Lavender Bloom Loop
Your Personal Tour Guide
Ask me questions while you tour the home.