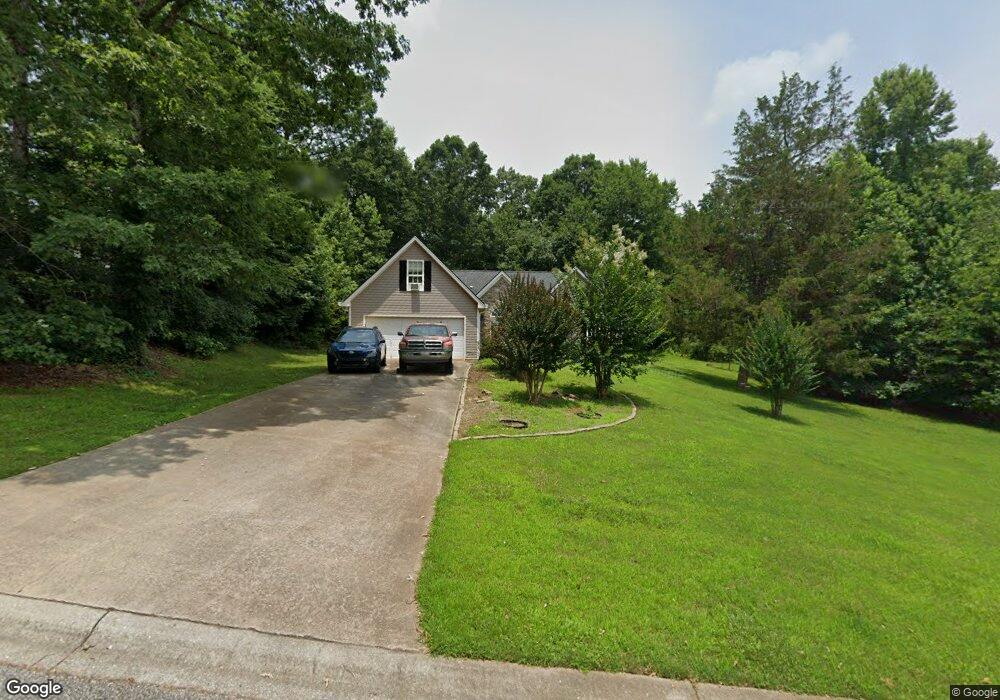
171 Lenox Dr Unit 34 Jefferson, GA 30549
Estimated Value: $335,000 - $374,000
4
Beds
2
Baths
1,808
Sq Ft
$195/Sq Ft
Est. Value
About This Home
This home is located at 171 Lenox Dr Unit 34, Jefferson, GA 30549 and is currently estimated at $352,168, approximately $194 per square foot. 171 Lenox Dr Unit 34 is a home located in Jackson County with nearby schools including Gum Springs Elementary School, West Jackson Middle School, and Jackson County High School.
Ownership History
Date
Name
Owned For
Owner Type
Purchase Details
Closed on
Nov 20, 2018
Sold by
Watkins Tim
Bought by
Nesser Cyndy and Nesser Katherine Darlene
Current Estimated Value
Home Financials for this Owner
Home Financials are based on the most recent Mortgage that was taken out on this home.
Original Mortgage
$152,915
Outstanding Balance
$133,356
Interest Rate
4.8%
Mortgage Type
New Conventional
Estimated Equity
$218,812
Purchase Details
Closed on
Feb 6, 2014
Sold by
Jpmorgan Chase Bank Nation
Bought by
Watkins Tim and Watkins Katherine
Home Financials for this Owner
Home Financials are based on the most recent Mortgage that was taken out on this home.
Original Mortgage
$118,367
Interest Rate
4.3%
Mortgage Type
New Conventional
Purchase Details
Closed on
Oct 1, 2013
Sold by
Kubacki Peter
Bought by
Jpmorgan Chase Bank National A
Purchase Details
Closed on
Oct 12, 2001
Sold by
Millstone Communitie
Bought by
Kubacki Peter J
Purchase Details
Closed on
May 24, 2001
Sold by
Wishbone Partners Ll
Bought by
Millstone Communitie
Create a Home Valuation Report for This Property
The Home Valuation Report is an in-depth analysis detailing your home's value as well as a comparison with similar homes in the area
Home Values in the Area
Average Home Value in this Area
Purchase History
| Date | Buyer | Sale Price | Title Company |
|---|---|---|---|
| Nesser Cyndy | $179,900 | -- | |
| Watkins Tim | $116,000 | -- | |
| Jpmorgan Chase Bank National A | $97,600 | -- | |
| Kubacki Peter J | $125,000 | -- | |
| Millstone Communitie | $275,000 | -- |
Source: Public Records
Mortgage History
| Date | Status | Borrower | Loan Amount |
|---|---|---|---|
| Open | Nesser Cyndy | $152,915 | |
| Previous Owner | Watkins Tim | $118,367 |
Source: Public Records
Tax History Compared to Growth
Tax History
| Year | Tax Paid | Tax Assessment Tax Assessment Total Assessment is a certain percentage of the fair market value that is determined by local assessors to be the total taxable value of land and additions on the property. | Land | Improvement |
|---|---|---|---|---|
| 2024 | $2,422 | $94,600 | $24,000 | $70,600 |
| 2023 | $2,405 | $85,760 | $24,000 | $61,760 |
| 2022 | $2,209 | $77,800 | $24,000 | $53,800 |
| 2021 | $1,897 | $66,600 | $12,800 | $53,800 |
| 2020 | $1,788 | $57,640 | $12,800 | $44,840 |
| 2019 | $1,875 | $57,640 | $12,800 | $44,840 |
| 2018 | $1,827 | $55,480 | $12,800 | $42,680 |
| 2017 | $1,810 | $54,528 | $12,800 | $41,728 |
| 2016 | $1,730 | $51,831 | $12,000 | $39,831 |
| 2015 | $1,547 | $47,934 | $10,000 | $37,934 |
| 2014 | $1,189 | $35,613 | $10,000 | $25,613 |
| 2013 | -- | $35,613 | $10,000 | $25,613 |
Source: Public Records
Map
Nearby Homes
- 171 Lenox Dr
- 181 Lenox Dr
- 26 Ashwick Dr
- 56 Ashwick Dr
- 146 Lenox Dr
- 170 Lenox Dr
- 106 Ashwick Dr
- 87 Lenox Dr
- 122 Lenox Dr
- 41 Ashwick Dr
- 0 Ashwick Dr Unit 8005694
- 0 Ashwick Dr Unit 7561445
- 0 Ashwick Dr Unit 8258303
- 144 Ashwick Dr
- 63 Ashwick Dr
- 170 Ashwick Dr
- 100 Lenox Dr
- 87 Ashwick Dr
- 107 Ashwick Dr
- 129 Ashwick Dr