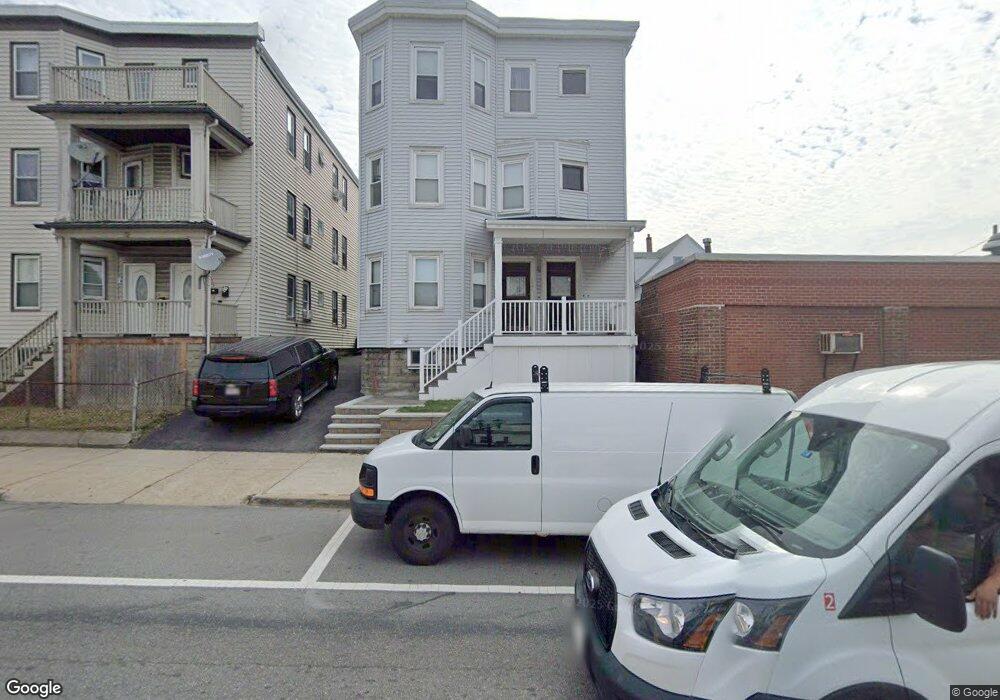
171 Main St Everett, MA 02149
West Everett NeighborhoodEstimated Value: $962,000 - $1,029,000
6
Beds
3
Baths
3,726
Sq Ft
$269/Sq Ft
Est. Value
About This Home
This home is located at 171 Main St, Everett, MA 02149 and is currently estimated at $1,003,333, approximately $269 per square foot. 171 Main St is a home located in Middlesex County with nearby schools including Everett High School, Pioneer Charter School of Science, and St Anthony School.
Ownership History
Date
Name
Owned For
Owner Type
Purchase Details
Closed on
May 18, 2021
Sold by
Hanlon John F and Hanlon Frances D
Bought by
Hanlon Ft
Current Estimated Value
Purchase Details
Closed on
Jan 1, 1974
Bought by
Hanlon John F and Hanlon Frances D
Create a Home Valuation Report for This Property
The Home Valuation Report is an in-depth analysis detailing your home's value as well as a comparison with similar homes in the area
Home Values in the Area
Average Home Value in this Area
Purchase History
| Date | Buyer | Sale Price | Title Company |
|---|---|---|---|
| Hanlon Ft | -- | None Available | |
| Hanlon John F | -- | -- |
Source: Public Records
Mortgage History
| Date | Status | Borrower | Loan Amount |
|---|---|---|---|
| Previous Owner | Hanlon John F | $60,000 | |
| Previous Owner | Hanlon John F | $50,000 | |
| Previous Owner | Hanlon John F | $630,000 | |
| Previous Owner | Hanlon John F | $75,000 |
Source: Public Records
Tax History
| Year | Tax Paid | Tax Assessment Tax Assessment Total Assessment is a certain percentage of the fair market value that is determined by local assessors to be the total taxable value of land and additions on the property. | Land | Improvement |
|---|---|---|---|---|
| 2025 | $10,506 | $922,400 | $203,600 | $718,800 |
| 2024 | $9,780 | $853,400 | $189,700 | $663,700 |
| 2023 | $9,624 | $817,000 | $180,500 | $636,500 |
| 2022 | $7,958 | $768,100 | $180,500 | $587,600 |
| 2021 | $7,329 | $742,600 | $174,000 | $568,600 |
| 2020 | $7,467 | $701,800 | $174,000 | $527,800 |
| 2019 | $7,874 | $636,000 | $165,700 | $470,300 |
| 2018 | $7,422 | $538,600 | $144,400 | $394,200 |
| 2017 | $7,035 | $487,200 | $120,300 | $366,900 |
| 2016 | $6,335 | $438,400 | $111,100 | $327,300 |
| 2015 | $5,990 | $410,000 | $104,400 | $305,600 |
Source: Public Records
Map
Nearby Homes
- 39 Parlin St Unit 203
- 9 Carter St
- 24 Corey St Unit 101
- 39 Montrose St Unit 2
- 19 Heath St
- 34 Paris St
- 48 Cleveland Ave
- 340 Main St
- 43 Charlton St Unit B108
- 30 Chelsea St Unit 210
- 139 Bucknam St
- 44-46 Cabot St
- 37 Argyle St
- 121 Cottage St
- 15 Staples Ave Unit 45
- 15 Staples Ave Unit 31
- 21 Staples Ave Unit 26
- 21 Central Ave Unit 10
- 44 Walnut St
- 120 Wyllis Ave Unit 217
- 177 Main St
- 11 Kk Terrace
- 9 Winthrop St
- 9 Winthrop St Unit 1
- 7 Winthrop St Unit 34
- 14 K k Terrace
- 14 K Terrace Unit 2
- 14 K Terrace Unit 1
- 170 Main St
- 178 Main St
- 11 Winthrop St
- 16 K k Terrace
- 161 Main St
- 161 Main St Unit REAR
- 161R Main St
- 16 K Terrace
- 9 K Terrace
- 9 K k Terrace
- 9 Parlin St
- 9 Parlin St Unit 1
Your Personal Tour Guide
Ask me questions while you tour the home.