
Landlord's Agent in 2019
Eleanor Reilly
Coldwell Banker Realty - Needham
(617) 448-4785
12 in this area
38 Total Sales


Estimated Value: $636,492 - $856,000
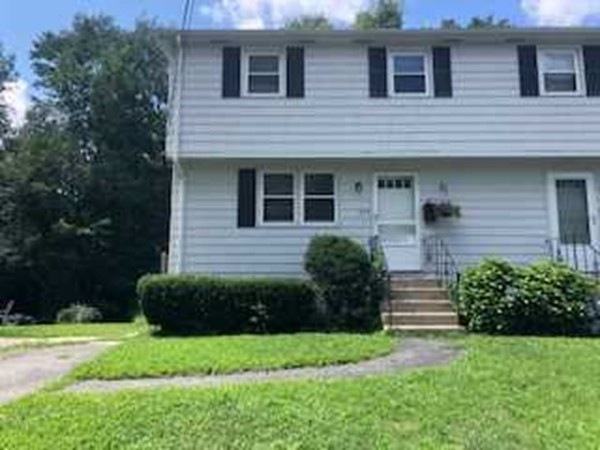
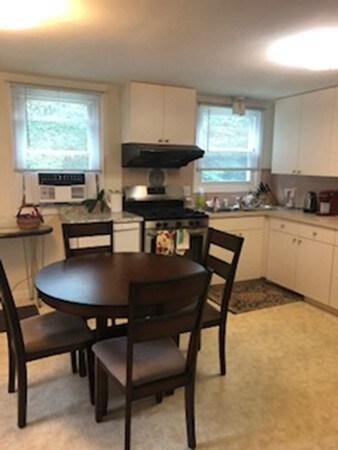
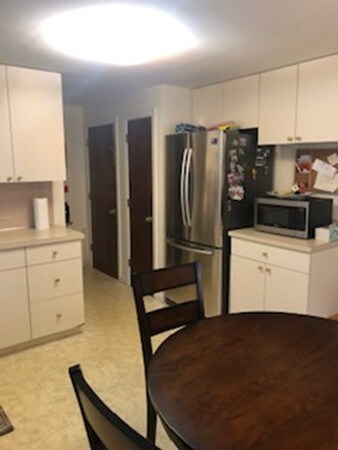
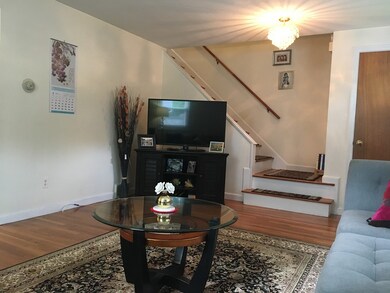
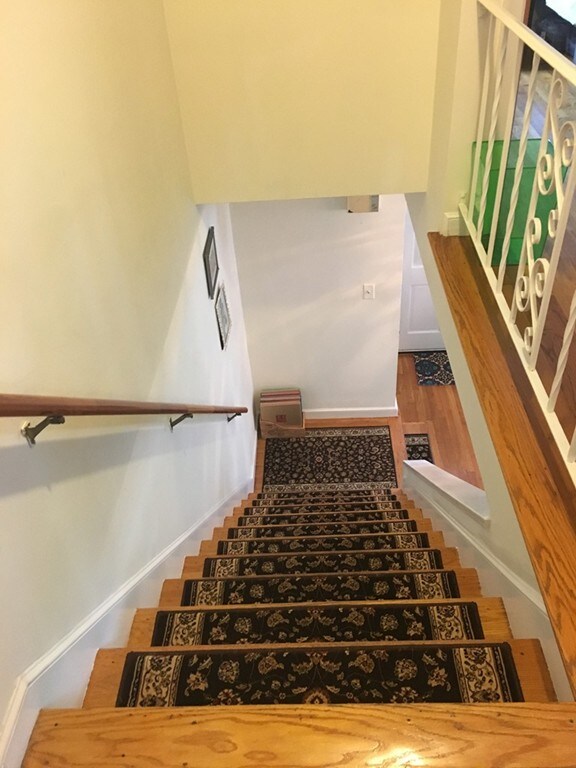
Perfect location for commuting to work or school. Needham Center is just steps from this sunny 3 bedroom/1.5 bath townhouse. First floor features spacious living, dining and kitchen area along with a powder room. Second floor has 3 bedrooms, full bath and abundant closet space. Back yard shed available for outdoor storage. Large bonus space in the basement for storage and laundry. Driveway parking, shared outdoor space and an ideal location all included in this in-town gem! Landlord will consider rent of $2300 if tenant takes care of lawn and snow removal. One small dog and/or cat allowed.
Last Agent to Rent the Property
Coldwell Banker Realty - Needham Listed on: 08/09/2019
| Date | Buyer | Sale Price | Title Company |
|---|---|---|---|
| Ju Meihua | $344,800 | -- |
| Date | Status | Borrower | Loan Amount |
|---|---|---|---|
| Open | Ju Meihua | $275,800 | |
| Closed | Ju Meihua | $41,400 |
| Date | Event | Price | List to Sale | Price per Sq Ft |
|---|---|---|---|---|
| 09/28/2019 09/28/19 | Rented | $2,200 | -8.3% | -- |
| 09/16/2019 09/16/19 | Under Contract | -- | -- | -- |
| 08/09/2019 08/09/19 | For Rent | $2,400 | +26.3% | -- |
| 11/15/2014 11/15/14 | Rented | $1,900 | -5.0% | -- |
| 10/16/2014 10/16/14 | Under Contract | -- | -- | -- |
| 10/14/2014 10/14/14 | For Rent | $2,000 | -- | -- |
| Year | Tax Paid | Tax Assessment Tax Assessment Total Assessment is a certain percentage of the fair market value that is determined by local assessors to be the total taxable value of land and additions on the property. | Land | Improvement |
|---|---|---|---|---|
| 2025 | $5,456 | $514,700 | $0 | $514,700 |
| 2024 | $6,230 | $497,600 | $0 | $497,600 |
| 2023 | $6,240 | $478,500 | $0 | $478,500 |
| 2022 | $6,398 | $478,500 | $0 | $478,500 |
| 2021 | $5,422 | $416,100 | $0 | $416,100 |
| 2020 | $4,951 | $396,400 | $0 | $396,400 |
| 2019 | $4,465 | $360,400 | $0 | $360,400 |
| 2018 | $3,736 | $314,500 | $0 | $314,500 |
| 2017 | $3,739 | $314,500 | $0 | $314,500 |
| 2016 | $3,629 | $314,500 | $0 | $314,500 |
| 2015 | $3,205 | $283,900 | $0 | $283,900 |
| 2014 | $3,144 | $270,100 | $0 | $270,100 |
Landlord's Agent in 2019
Eleanor Reilly
Coldwell Banker Realty - Needham
(617) 448-4785
12 in this area
38 Total Sales
L
Seller's Agent in 2014
Lichang Shepherd
Network Real Estate
(617) 939-4016
Source: MLS Property Information Network (MLS PIN)
MLS Number: 72547571
APN: NEED-000133-000019-000171
Disclaimer: Certain information contained herein is derived from information provided by parties other than Homes.com. All information provided is deemed reliable, but is not guaranteed to be accurate and should be independently verified.
![]() The property listing data and information, or the Images, set forth herein were provided to MLS Property Information Network, Inc. from third party sources, including sellers, lessors and public records, and were compiled by MLS Property Information Network, Inc. The property listing data and information, and the Images, are for the personal, non-commercial use of consumers having a good faith interest in purchasing or leasing listed properties of the type displayed to them and may not be used for any purpose other than to identify prospective properties which such consumers may have a good faith interest in purchasing or leasing. MLS Property Information Network, Inc. and its subscribers disclaim any and all representations and warranties as to the accuracy of the property listing data and information, or as to the accuracy of any of the Images, set forth herein.
The property listing data and information, or the Images, set forth herein were provided to MLS Property Information Network, Inc. from third party sources, including sellers, lessors and public records, and were compiled by MLS Property Information Network, Inc. The property listing data and information, and the Images, are for the personal, non-commercial use of consumers having a good faith interest in purchasing or leasing listed properties of the type displayed to them and may not be used for any purpose other than to identify prospective properties which such consumers may have a good faith interest in purchasing or leasing. MLS Property Information Network, Inc. and its subscribers disclaim any and all representations and warranties as to the accuracy of the property listing data and information, or as to the accuracy of any of the Images, set forth herein.
Ask me questions while you tour the home.