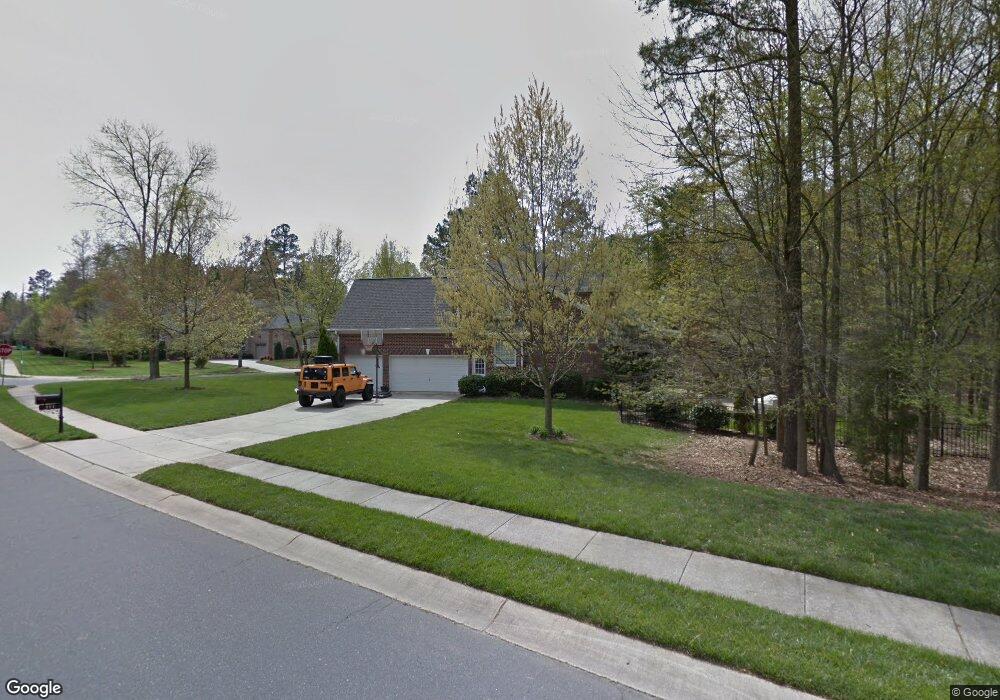
171 Mill Pond Rd Unit 102 Clover, SC 29710
Estimated Value: $781,000 - $852,000
--
Bed
4
Baths
3,910
Sq Ft
$208/Sq Ft
Est. Value
About This Home
This home is located at 171 Mill Pond Rd Unit 102, Clover, SC 29710 and is currently estimated at $814,073, approximately $208 per square foot. 171 Mill Pond Rd Unit 102 is a home located in York County with nearby schools including Oakridge Elementary School, Oakridge Middle School, and Clover High School.
Ownership History
Date
Name
Owned For
Owner Type
Purchase Details
Closed on
Dec 3, 2018
Sold by
Jarman Richard R and Jarman Amanda S
Bought by
Stenner Rio Christine and Stenner Mark Timothy
Current Estimated Value
Home Financials for this Owner
Home Financials are based on the most recent Mortgage that was taken out on this home.
Original Mortgage
$397,800
Outstanding Balance
$249,184
Interest Rate
4.8%
Mortgage Type
New Conventional
Estimated Equity
$564,889
Purchase Details
Closed on
Mar 2, 2018
Sold by
Watson Stanley W and Watson Stacy L
Bought by
Jarman Richard R and Jarman Amanda S
Purchase Details
Closed on
Sep 11, 2003
Sold by
Weekley Homes Lp
Bought by
Watson Stanley W and Watson Stacy L
Purchase Details
Closed on
Dec 27, 2002
Sold by
Crescent Resources Llc
Bought by
Weekley Homes Lp
Create a Home Valuation Report for This Property
The Home Valuation Report is an in-depth analysis detailing your home's value as well as a comparison with similar homes in the area
Home Values in the Area
Average Home Value in this Area
Purchase History
| Date | Buyer | Sale Price | Title Company |
|---|---|---|---|
| Stenner Rio Christine | $468,000 | None Available | |
| Jarman Richard R | $469,200 | None Available | |
| Watson Stanley W | $358,528 | -- | |
| Weekley Homes Lp | $200,000 | -- |
Source: Public Records
Mortgage History
| Date | Status | Borrower | Loan Amount |
|---|---|---|---|
| Open | Stenner Rio Christine | $397,800 |
Source: Public Records
Tax History Compared to Growth
Tax History
| Year | Tax Paid | Tax Assessment Tax Assessment Total Assessment is a certain percentage of the fair market value that is determined by local assessors to be the total taxable value of land and additions on the property. | Land | Improvement |
|---|---|---|---|---|
| 2025 | $2,954 | $21,579 | $2,503 | $19,076 |
| 2024 | $2,651 | $18,764 | $3,000 | $15,764 |
| 2023 | $2,715 | $18,738 | $3,000 | $15,738 |
| 2022 | $2,237 | $18,738 | $3,000 | $15,738 |
| 2021 | -- | $18,738 | $3,000 | $15,738 |
| 2020 | $2,121 | $18,738 | $0 | $0 |
| 2019 | $2,164 | $17,520 | $0 | $0 |
| 2018 | $1,981 | $27,450 | $0 | $0 |
| 2017 | $1,845 | $15,960 | $0 | $0 |
| 2016 | $1,738 | $15,960 | $0 | $0 |
| 2014 | $1,692 | $15,960 | $2,600 | $13,360 |
| 2013 | $1,692 | $15,580 | $2,600 | $12,980 |
Source: Public Records
Map
Nearby Homes
- 1921 Notchwood Ct
- 1727 Mineral Springs Rd
- 2678 Landing Pointe Dr
- 2323 Branch Hill Ln
- 319 Inland Cove Ct
- 304 Inland Cove Ct
- 0000 Senator Rd
- 2180 Shady Pond Dr
- 2099 Shady Pond Dr
- 2095 Shady Pond Dr
- 1437 Harpers Inlet Dr
- 743 Waterfall Way
- 1032 Valley Forge Dr
- 1026 Valley Forge Dr
- 236 Robinwood Ln
- 126 Misty Woods Dr
- 5000 Mill Creek Rd
- 121 Misty Woods Dr
- 1411 Swaying Branch Ln
- 1718 Santa Clara Trace
- 171 Mill Pond Rd
- 1708 Mineral Springs Rd
- 173 Mill Pond Rd
- 172 Mill Pond Rd
- 1712 Mineral Springs Rd
- 1703 Mineral Springs Rd Unit 204
- 176 Mill Pond Rd
- 1707 Mineral Springs Rd
- 177 Mill Pond Rd
- 3104 Shady Knoll Ct
- 180 Mill Pond Rd
- 1500 Calvin Hal Ln
- 1500 Calvin Hal Ln Unit 164
- 1505 Calvin Hal Ln
- 1711 Mineral Springs Rd
- 1718 Mineral Springs Rd
- 3109 Shady Knoll Ct
- 181 Mill Pond Rd
- 1910 Notchwood Ct
- 1914 Notchwood Ct